Choosing the Right Basemap in Plex-Earth: Google, Azure, or OpenStreetMap
The basemap you choose sets the foundation for everything.
When you start a new infrastructure or site design project in AutoCAD, Civil 3D, or BricsCAD, one of the first things you need is site context. Roads, buildings, terrain, surrounding infrastructure, everything that helps you understand where your design will live.
So naturally, the first step is to load a basemap.
For many engineers, that means falling back on what’s familiar: the built-in CAD basemap, or a quick grab from Google Earth. And these workflows get the job done often enough. But anyone who’s waited for the tiles to load across a large corridor or spent 20 minutes scaling and nudging a blurry screenshot into place knows that they come with a cost.
The most frustrating part is that a lot of the problems only become clear once you start sketching layouts or planning alignment. Luckily, many can be avoided by choosing the right basemap from the start.
In this guide, we’ll compare the main basemap providers available in Plex-Earth, Google Maps, Azure Maps, and OpenStreetMap and explain when each one works best so you can select the right context for your project from the beginning.
Common Basemap Workflows in CAD without Plex-Earth
Before tools like Plex-Earth existed, engineers typically relied on a few practical workarounds to bring map context into CAD.
Using the default CAD basemap or inserting Google Earth screenshots.
Both approaches can work for quick visual reference, but they often create friction during design work.
Using the Bing Basemap (Geolocation Command)
Many AutoCAD users start with the Geolocation command, which enables the built-in Bing Maps basemap.
A typical workflow would be: 1. setting the drawing coordinate system, 2. using the Geolocation command, 3. turning on the online map background, 4. finally using the imagery as a reference while drafting.
This method works well. But when working on larger sites or detailed planning tasks, several limitations become noticeable.
The most common issue is performance. Because the imagery is streamed online, the map must reload whenever you zoom or pan across the drawing. If the internet connection is slow or unstable, you will definitely notice. Sluggish navigation and disappearing tiles are the last thing you want to see on a tight deadline.
Another limitation is that the basemap is mainly intended as a visual reference, rather than a dataset you can easily manage, export, or integrate into your drawing.
For quick context checks, it works fine, but many engineers eventually look for a more flexible solution.
Stitching Google Earth Screenshots
Another very common workaround is capturing imagery (meaning screenshots) directly from Google Earth.
The workflow typically looks like this: 1. navigate to the project site in Google Earth, 2. capture one or more screenshots, 3. insert the images into CAD, 4. manually scale and align them.
Many engineers already trust Google Earth imagery, so it’s not a surprise that this is still a popular approach. But it introduces several (big) challenges you need to take into account.
The first issue is georeferencing. Because screenshots are not automatically aligned to your drawing’s coordinate system, they must be manually scaled and positioned. Even small mistakes can introduce alignment errors.
The second challenge appears when working on larger project areas. A single screenshot rarely covers the full site, so you end up capturing five, ten, sometimes more, then manually stitching them together in CAD while hoping the seams line up. By the time you have something usable, you've burned hours on a task that should have taken minutes.
Finally, the resolution of screenshots is limited. When zooming or printing plans, the imagery may become blurry or pixelated.
These workarounds are common because they are familiar, but they rarely provide the most efficient workflow.
Luckily, Plex-Earth can help eliminate the manual work entirely.
With Plex-Earth, the imagery comes in georeferenced and aligned to your drawing’s coordinate system. No stitching, scaling, or coordiante fuesswork. Let’s see how it works.
A better way: Basemaps in Plex-Earth
Instead of relying on screenshots or slow online maps, Plex-Earth allows engineers to import basemap imagery directly into AutoCAD, Civil 3D, and other popular CAD tools.
The platform provides access to multiple imagery providers, each with different strengths depending on coverage, resolution, and type of data.
Unlike manual screenshot workflows, Plex-Earth automatically creates multi-tile imagery mosaics directly from the providers’ databases.
To ensure the highest possible precision, each individual tile is automatically georeferenced, allowing the final mosaic to maintain accurate spatial alignment within the drawing.
Plex-Earth’s basemap providers available include:
Google Maps
Azure Maps
OpenStreetMap
Each provider offers global coverage but differs in imagery type, resolution, and use case. A useful way to understand imagery detail is through zoom levels, which correspond to the resolution of the imagery. For example:
Zoom level 21 ≈ 7.5 cm (3") / pixel
Zoom level 20 ≈ 15 cm (6") / pixel
Zoom level 19 ≈ 30 cm (12") / pixel
Higher zoom levels mean higher detail, but availability can vary depending on location.
Google Maps
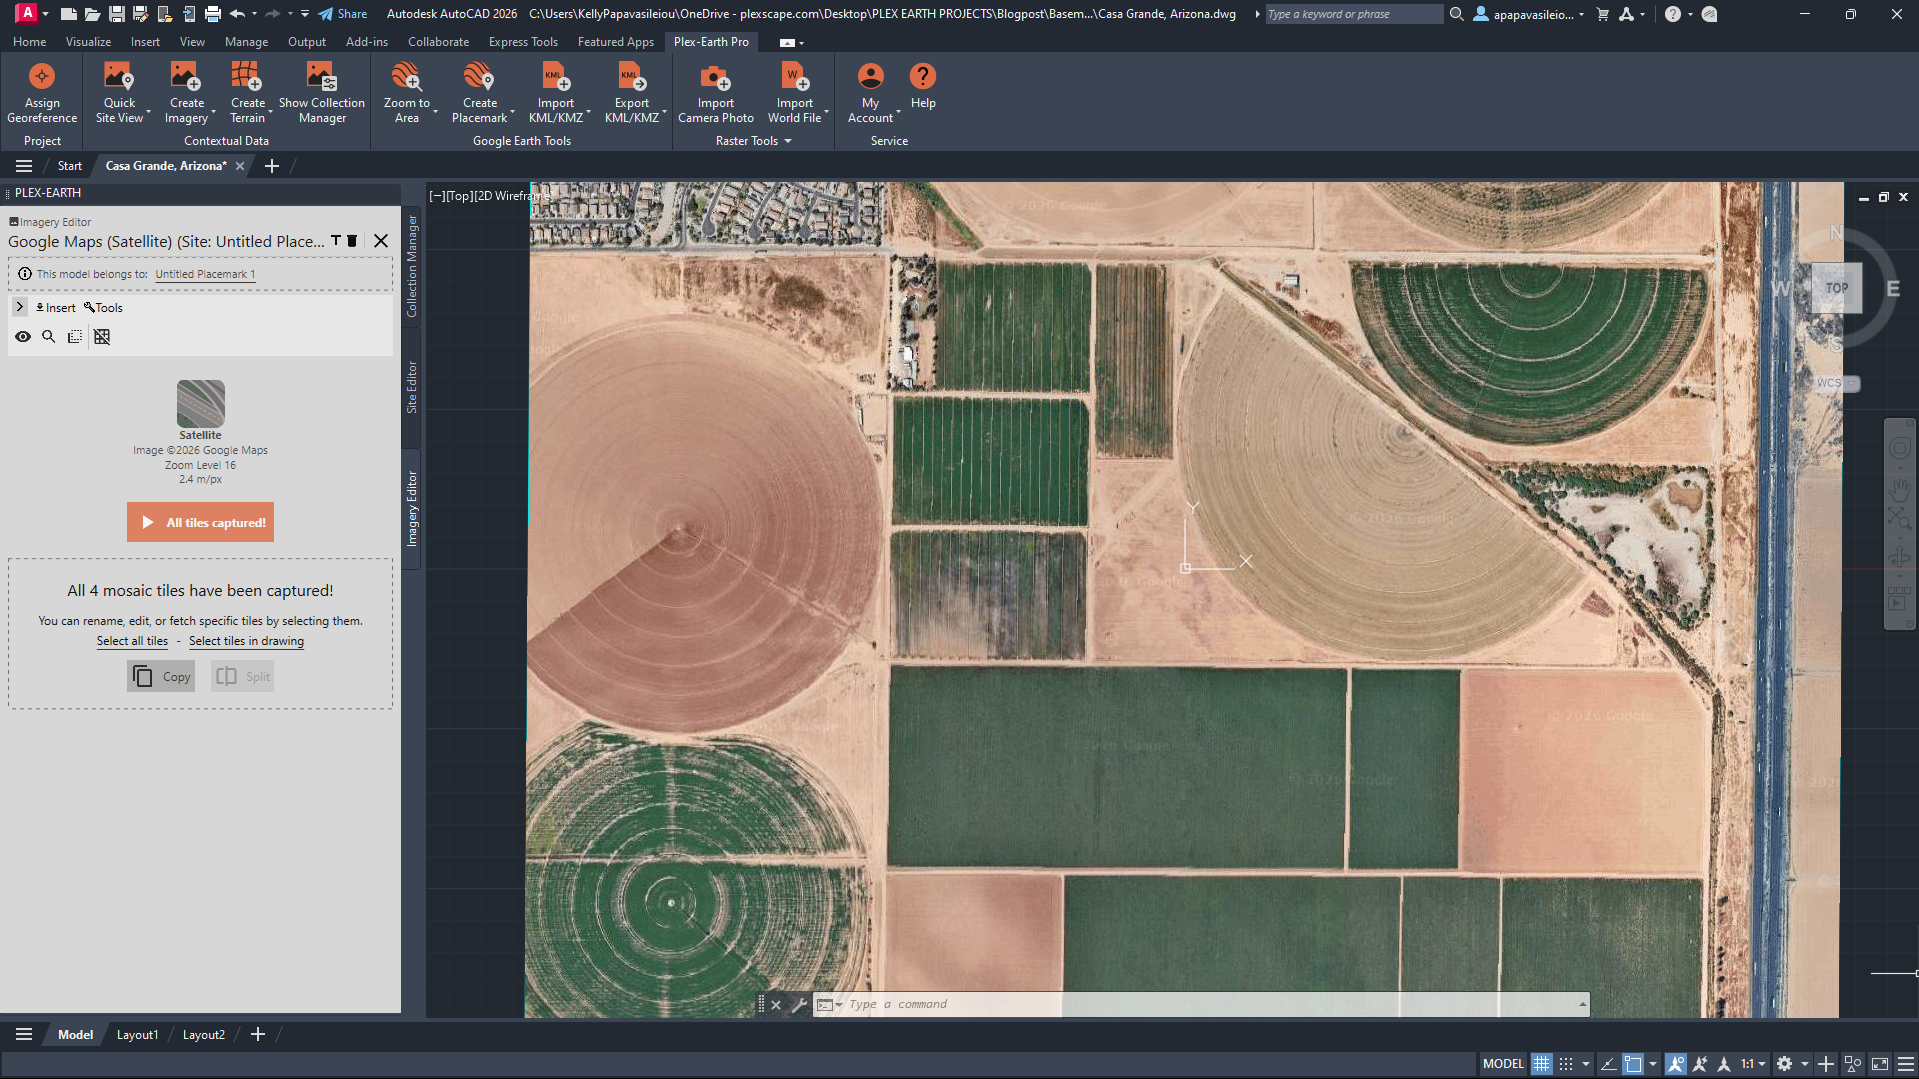
Agricultural fields near Casa Grande form a clear grid pattern typical of irrigated farmland in desert environments. The Google Maps imagery highlights field boundaries, irrigation layouts, and rural road networks across the landscape.
Provider: Google
Common use case: General reference and site orientation
Recency: Varies; major cities updated frequently, rural areas lag
Advantage: Ubiquitous and instantly recognizable
Common complaint: Resolution drops fast outside urban cores, can be outdated or covered in clouds in some areas
Google Maps is one of the most widely recognized imagery providers in the world.
Within Plex-Earth, Google imagery offers global coverage and supports several imagery types, including satellite, aerial, road, and hybrid layers.
The imagery is available in color and can reach a maximum zoom level of 21, which corresponds to very high resolution in areas where detailed imagery is available.
Google Maps collects data from over a thousand sources, including governments, imagery providers, and user contributions, which contribute to its broad coverage and accuracy.
Because of its strong coverage and consistent imagery quality, Google Maps is often the default starting point for engineers exploring a new site.
Best for:
Early planning and feasibility studies
Site reconnaissance
Preliminary layout planning
In many cases, Google imagery provides a reliable baseline for understanding a project location before moving into more detailed design analysis.
Azure Maps
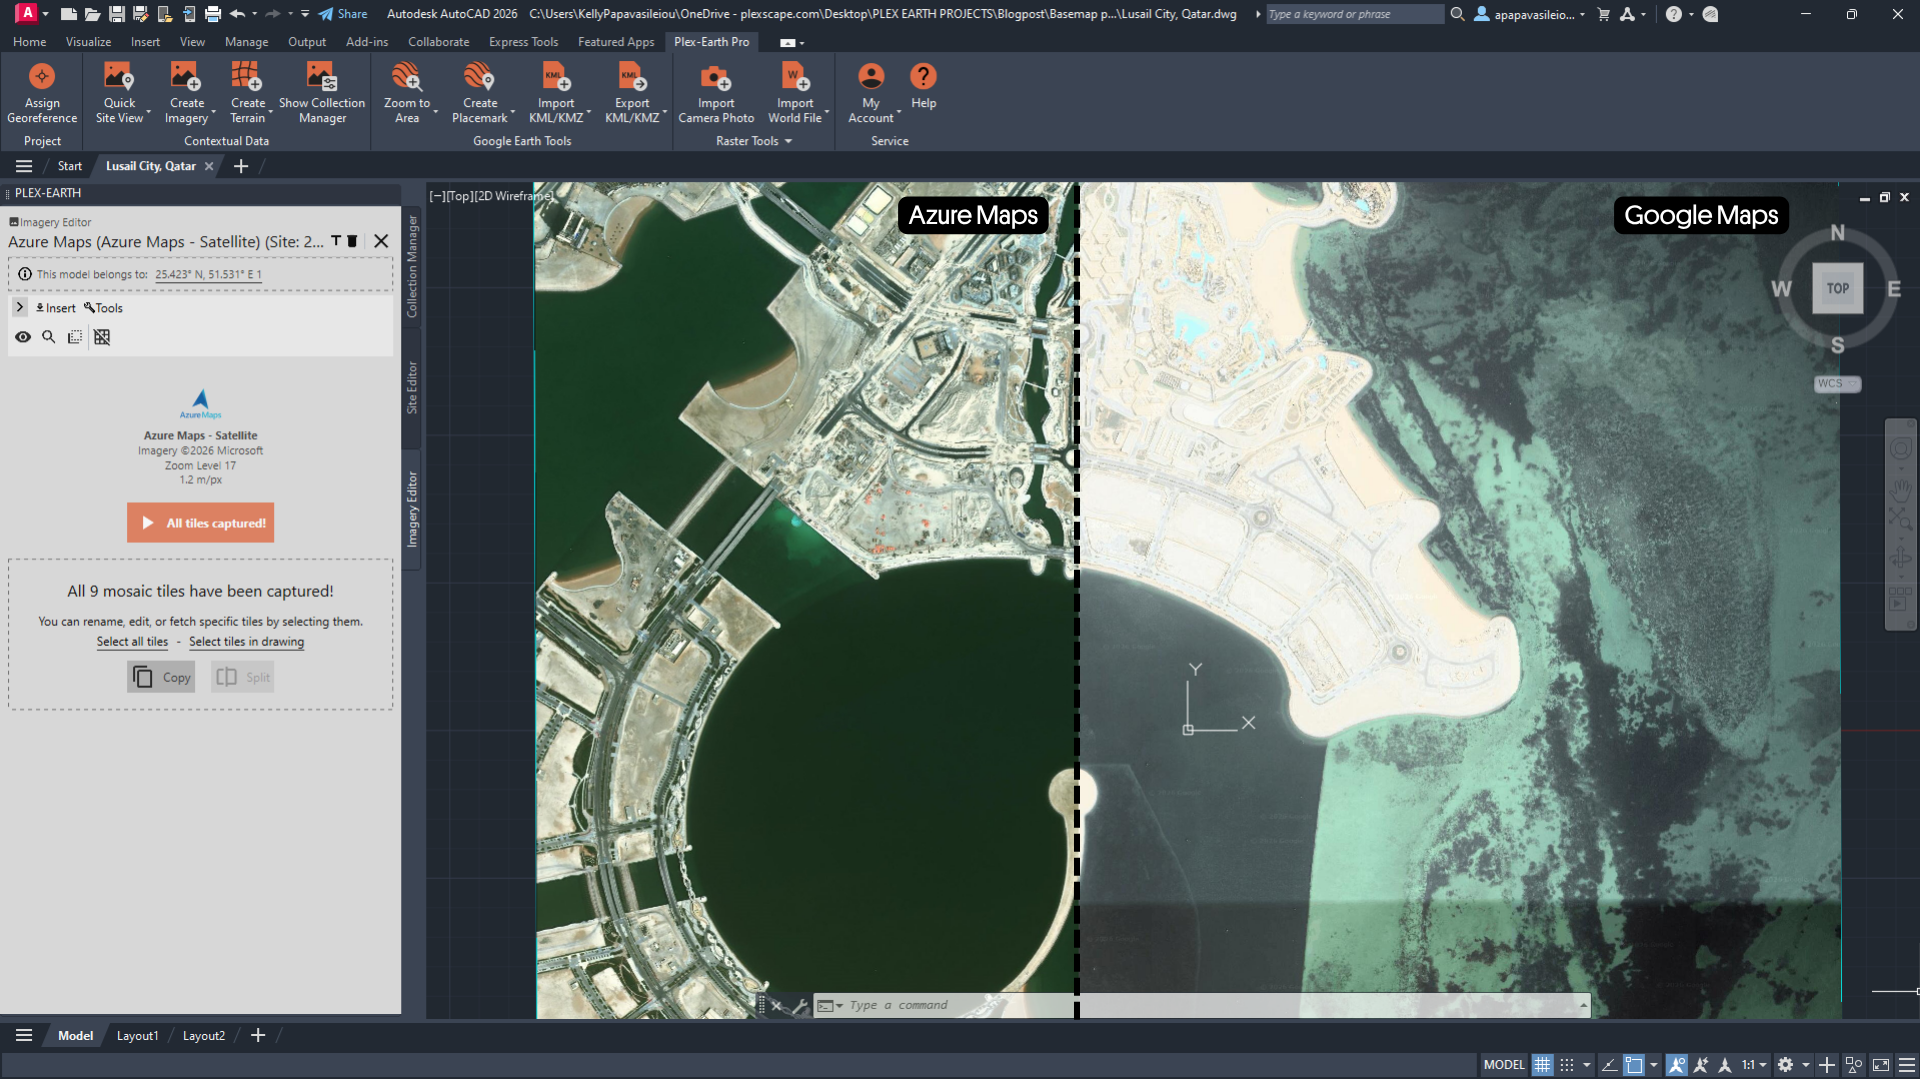
In this example, the Google Maps image appears brighter and slightly washed out due to lighting conditions or atmospheric effects during capture, while the Azure Maps image shows more natural colors and clearer ground details.
Provider: Microsoft
Common use case: Alternative basemap when Google imagery is limited
Recency: Varies by region and imagery source
Advantage: Consistent global coverage; useful for cross-checking imagery
Common complaint: Resolution can be lower in some urban areas, and it can also be outdated or covered in clouds in some areas
Azure Maps (formerly Bing Maps imagery services) is another global basemap provider available in Plex-Earth.
It provides aerial and satellite imagery and is widely used across enterprise and mapping applications.
Azure Maps supports imagery up to zoom level 20, which corresponds to approximately 15 cm per pixel in areas where high-resolution imagery is available.
While some users are less familiar with Azure imagery, it can sometimes provide better and more recent in specific regions, making it useful when comparing basemap options.
Best for:
Azure imagery can serve as an alternative global imagery source when imagery from another provider (such as Google) is limited, outdated, or insufficiently clear in a specific location.
OpenStreetMap
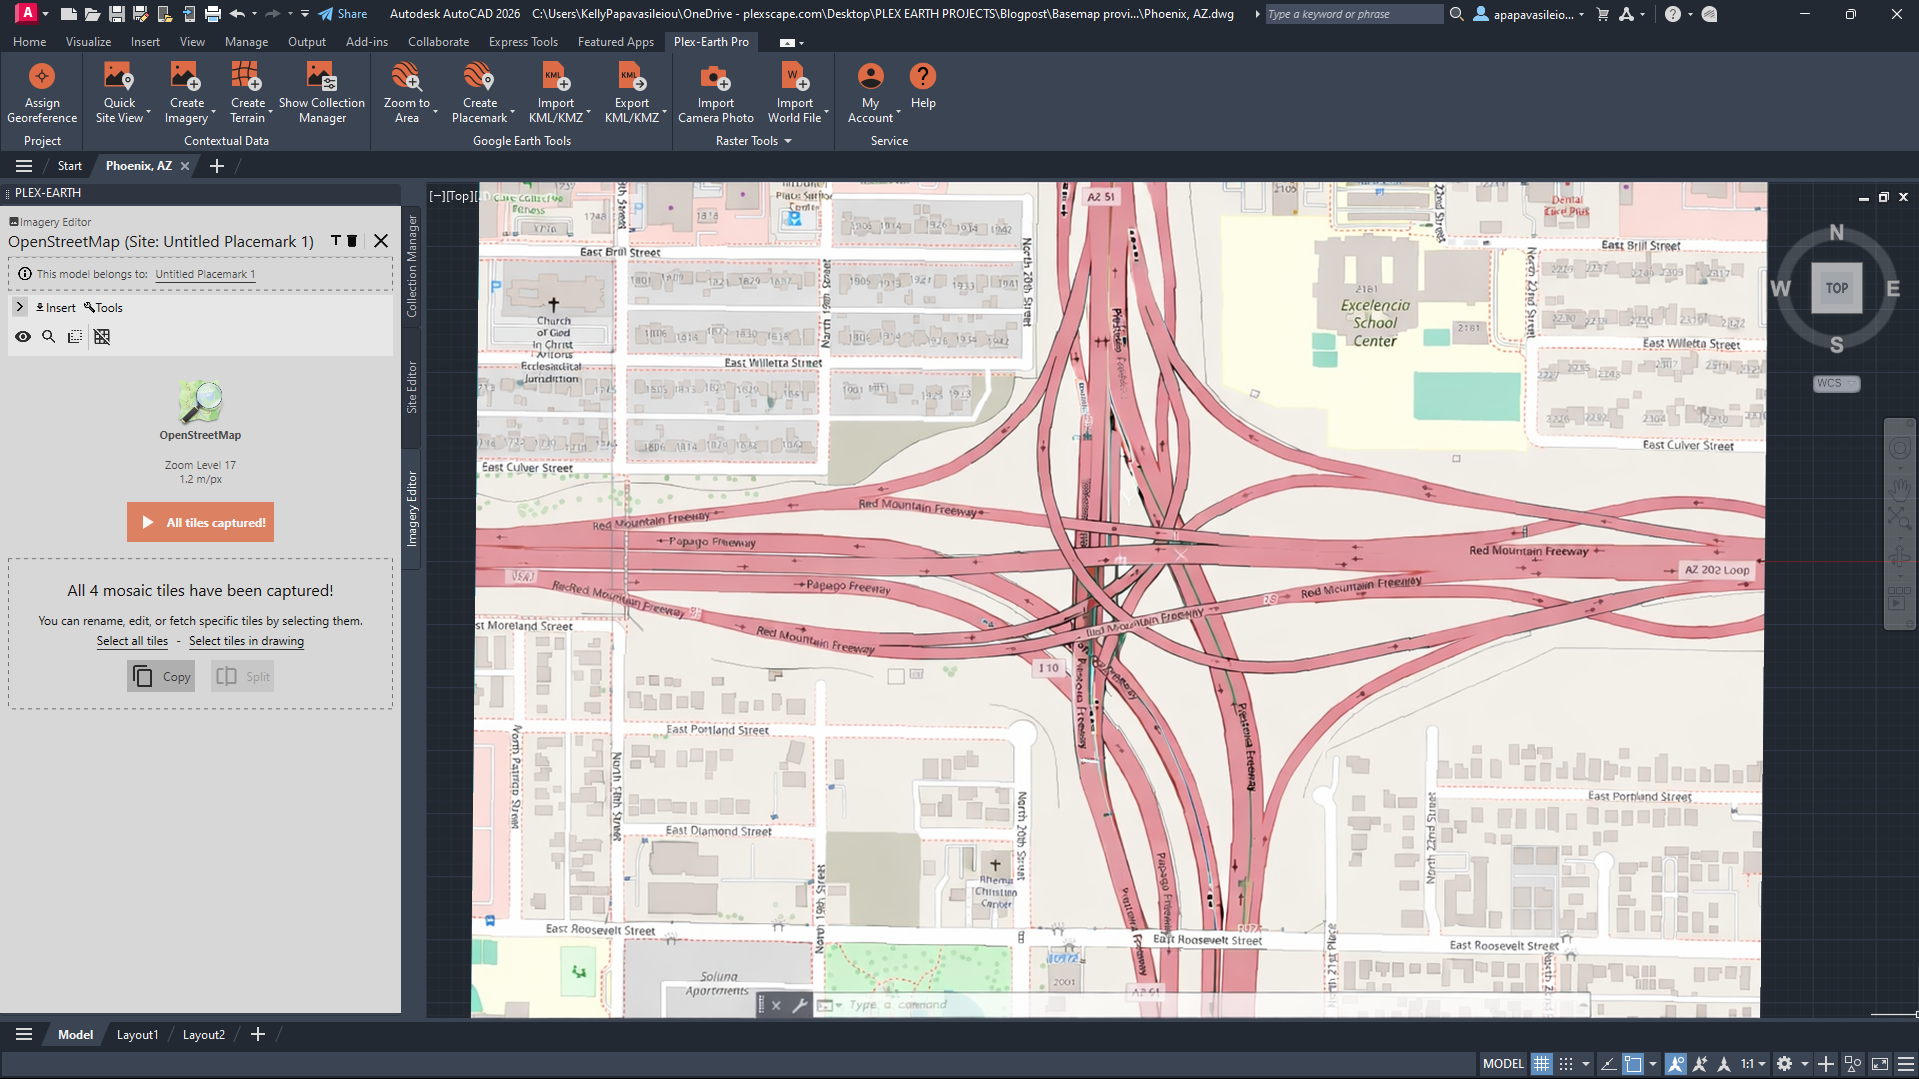
The OpenStreetMap image shows a complex highway interchange in Phoenix, Arizona, where multiple freeways intersect. The map clearly illustrates the road network, ramps, and surrounding streets, providing detailed vector information for navigation and spatial analysis
Provider: OpenStreetMap Foundation (OSMF)
Common use case: Viewing road networks and infrastructure features
Recency: Continuously updated by community contributors
Advantage: Detailed vector map data including roads, buildings, and infrastructure
Common complaint: No satellite imagery; data quality varies by region
OpenStreetMap differs from the previous providers because it focuses on vector map data rather than aerial imagery.
The dataset is built through global community contributions and provides detailed information about roads, infrastructure, buildings, and geographic features.
The OpenStreetMap basemap in Plex-Earth offers worldwide coverage and supports zoom levels up to 20.
Because it emphasizes map features instead of satellite imagery, it is particularly useful for understanding transportation networks and urban structure.
Best for:
Understanding transportation networks
Infrastructure planning
Projects where feature data is more important than imagery
OpenStreetMap is often used alongside imagery basemaps to provide additional geographic context.
When Basemaps Are Not Enough
While built-in basemaps provide a strong starting point for most projects, there are situations where they may not offer enough detail.
Engineers may encounter challenges such as:
Low imagery resolution
Outdated captures
Cloud coverage
Missing imagery in certain regions
When this happens, additional imagery sources may be required to properly analyze the project area.
Connecting Custom Map Services to CAD with Plex-Earth
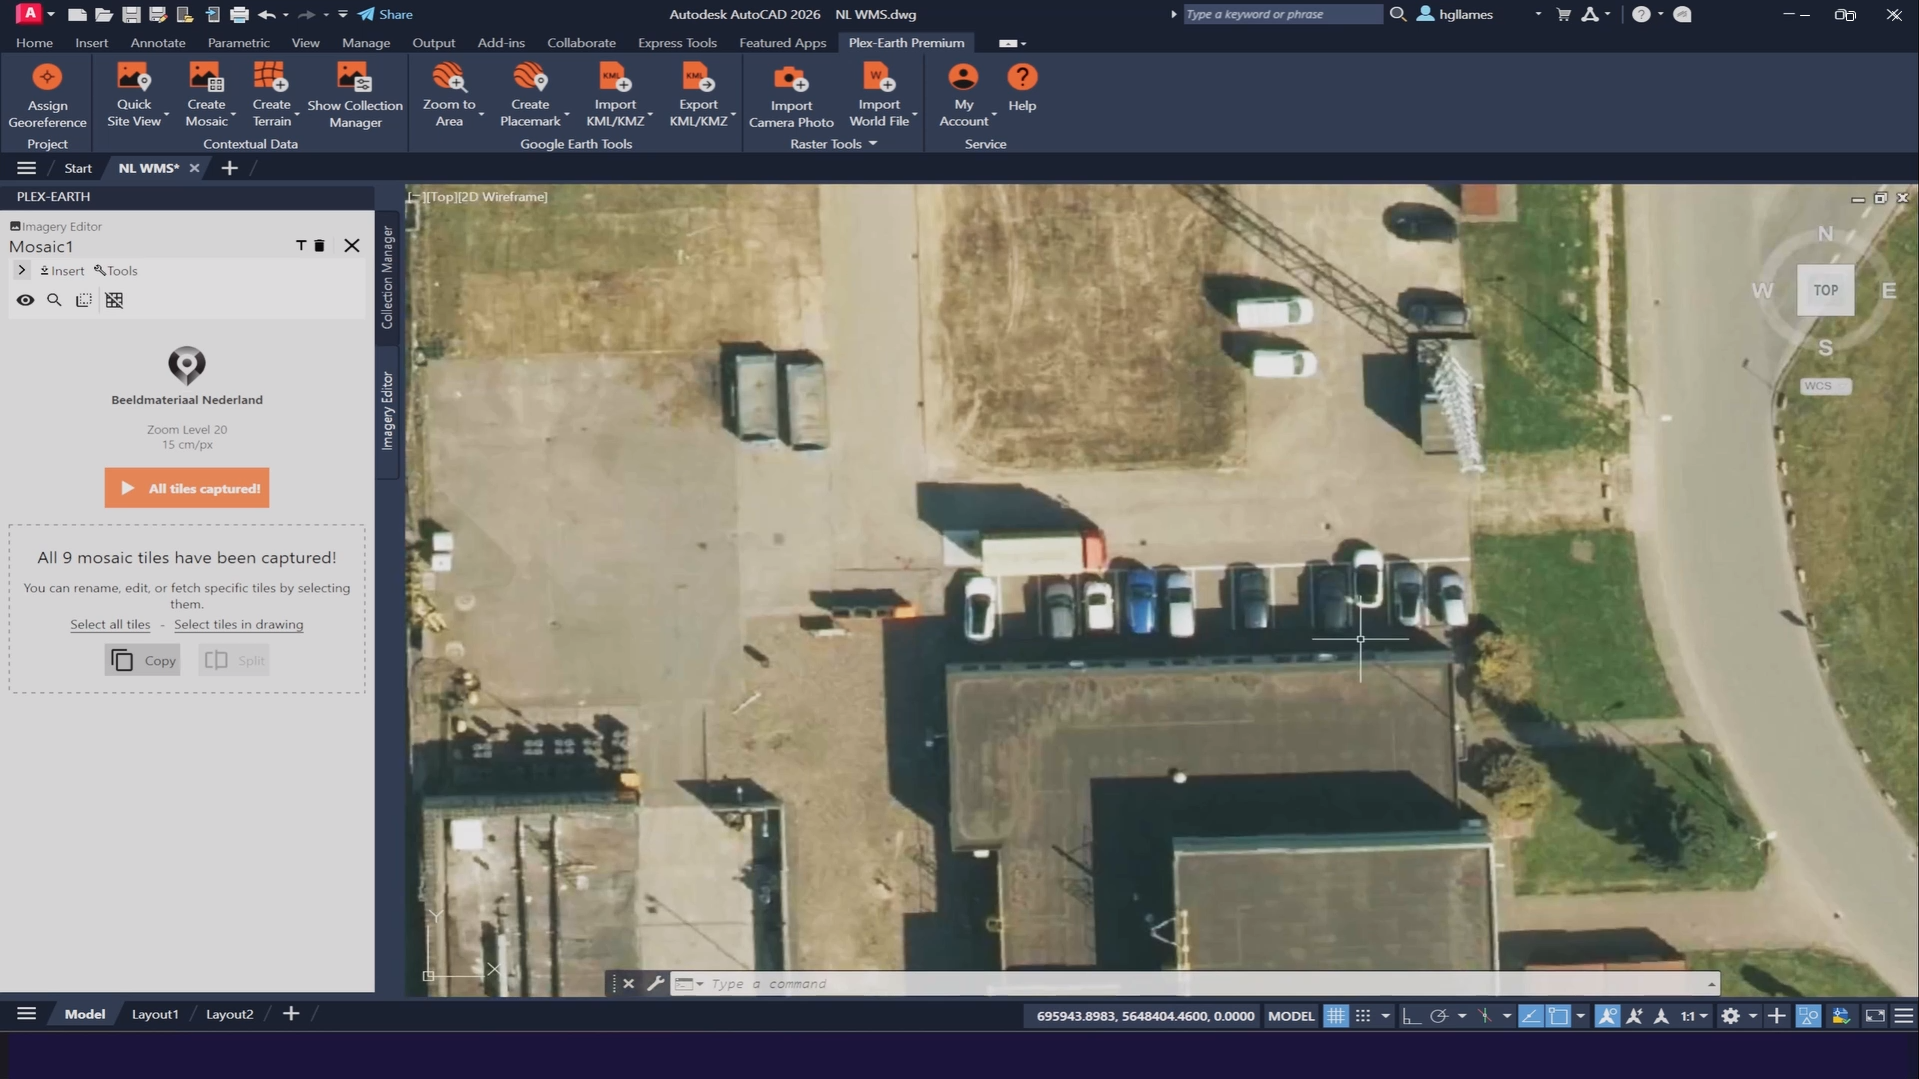
Using the Custom Map tool in Plex-Earth, we connected to the Beeldmateriaal Nederland WMS service and streamed a 2025 high-resolution orthomosaic directly into the drawing.
Provider: Plex-Earth Aerial imagery © Beeldmateriaal Nederland (CC BY 4.0)
Plex-Earth allows engineers to connect external map services through the Map Explorer tool.
These services may include:
WMS (Web Map Service)
WMTS (Web Map Tile Service)
Tile Servers / XYZ tiles
ArcGIS Map Server / ArcGIS REST services
By connecting external services, you can access regional or national imagery datasets and use them directly in your CAD drawings.
Some national mapping agencies provide orthophotos or aerial imagery through WMS services, offering higher resolution data than global basemaps.
Because these datasets vary widely, the available resolution, zoom levels, and coverage depend on the provider.
When You Need Higher Resolution Imagery
For projects requiring even more detailed imagery, Plex-Earth supports integration with several premium providers.
These include: Vexcel, Nearmap, Hexagon, Airbus & Vantor (formerly Maxar).
Premium imagery often reaches zoom levels around 19–21, providing detailed views of buildings, roads, and surface conditions.
Each of these providers supports different engineering workflows. Let’s look at some typical use cases.
Vexcel
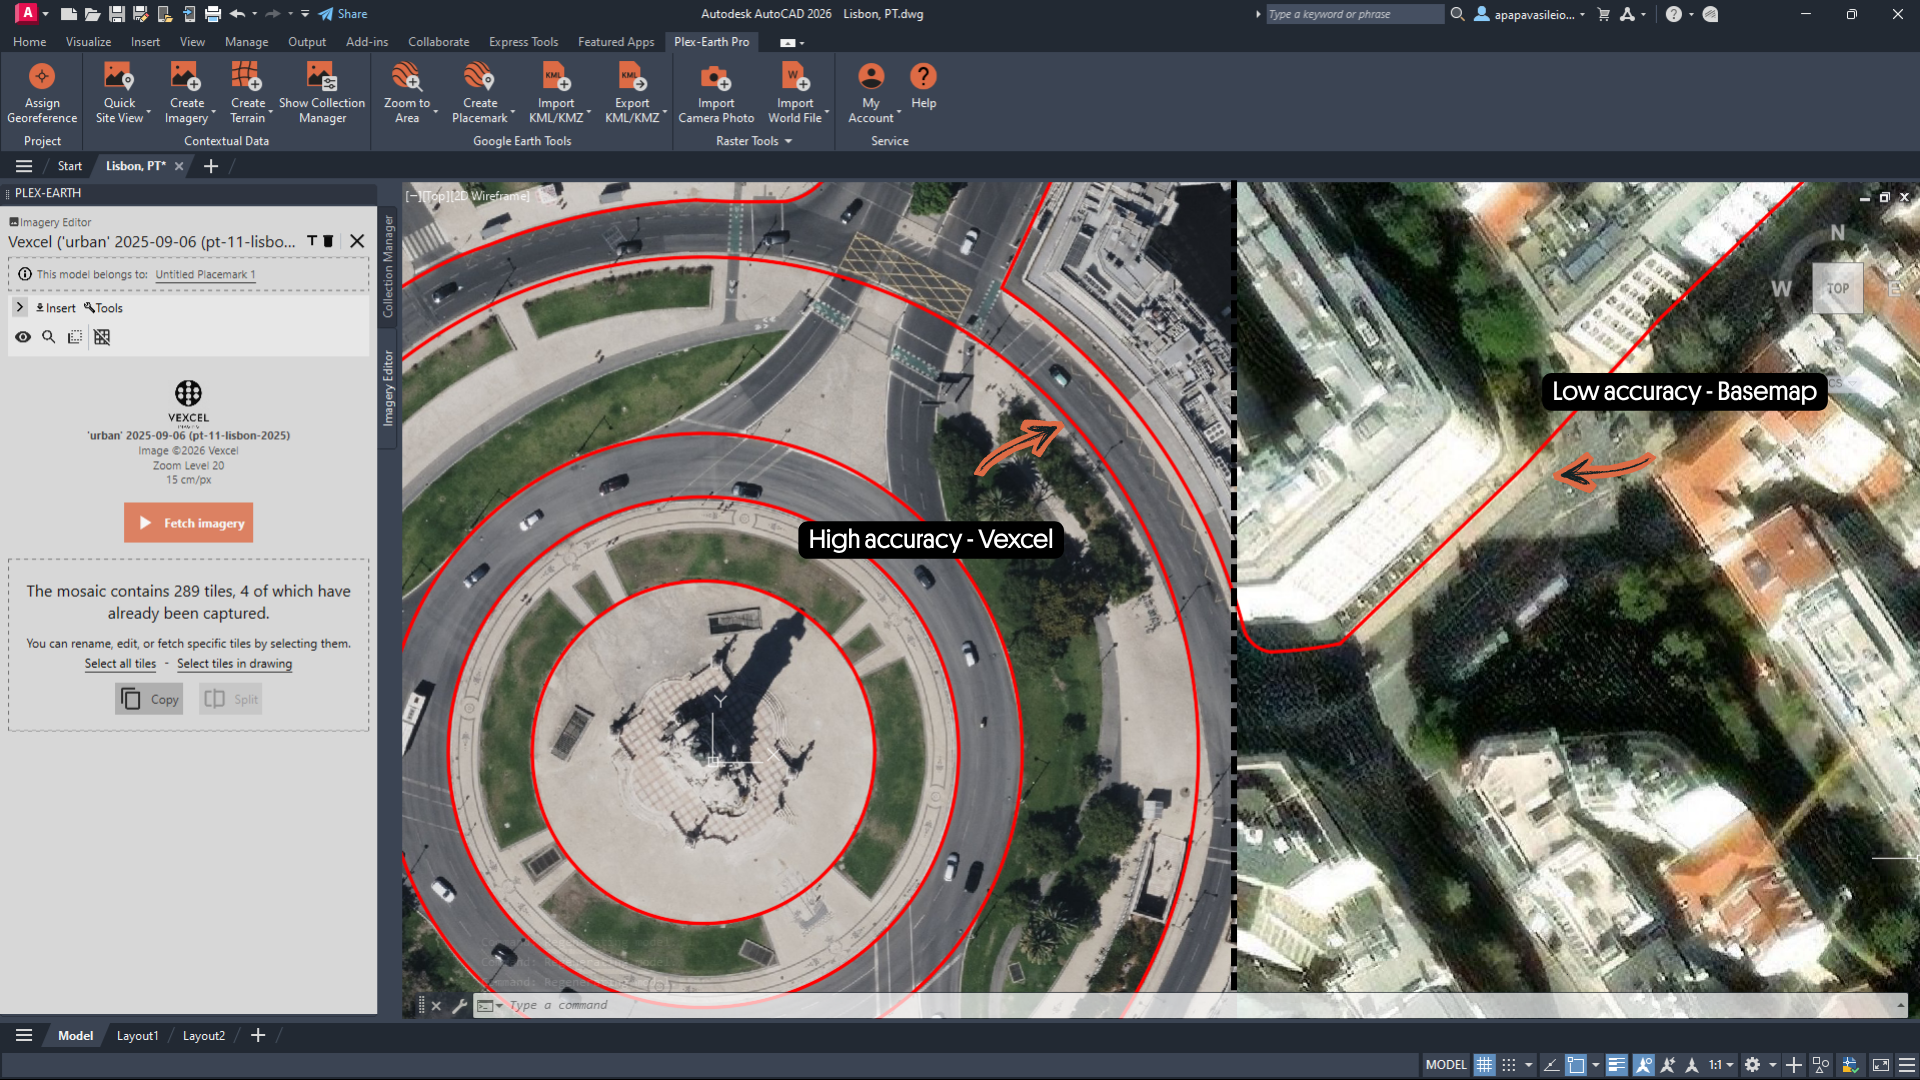
Unlike standard basemaps, Vexcel high-quality orthomosaics show true top-down detail, with consistent georeferencing accuracy . Making it reliable for measurements and design placement, even at regional scale.
Provider: Vexcel Imaging
Common use case: Large-scale mapping and infrastructure assessment across wide geographic areas
Recency: Updated on regular national and regional capture cycles, typically annually in covered areas
Advantage: Ultra-wide area coverage with consistent, high-resolution aerial imagery at scale (3"-6")
Vexcel Imaging provides high-resolution aerial imagery captured at regional and national scale, making it well-suited for projects that span large or distributed geographies. Their UltraCam sensor systems produce orthomosaic imagery with accurate georeferencing and broad areal coverage, giving engineers and planners a consistent, reliable dataset across extensive project extents without stitching together multiple sources.
Use cases
Utility and infrastructure corridor mapping
Engineers managing power lines, pipelines, and transport corridors use Vexcel imagery to survey large linear assets efficiently. Wide-area coverage reduces the need for multiple data sources, while consistent resolution across the full corridor supports accurate condition assessments and maintenance planning.
Flood and disaster response mapping
Emergency management teams and infrastructure owners use Vexcel's broad capture capability to assess damage across wide-affected regions following floods, storms, or earthquakes. The ability to compare pre- and post-event imagery at scale helps prioritise response efforts and document damage for recovery and insurance purposes.
Land use and regional planning
Government agencies and planning authorities use Vexcel imagery to monitor land use change, track urban growth, and support zoning and regional development decisions. Consistent capture cycles across large areas make it practical to compare conditions over time and identify trends across entire municipalities or regions.
Insurance portfolio risk assessment
Insurers managing large property portfolios use Vexcel's wide-area coverage to assess exposure and verify property characteristics at scale. Rather than evaluating individual sites in isolation, adjusters and risk teams can review entire neighbourhoods or regions from a single consistent dataset, supporting faster portfolio-level decisions after major weather events.
Nearmap
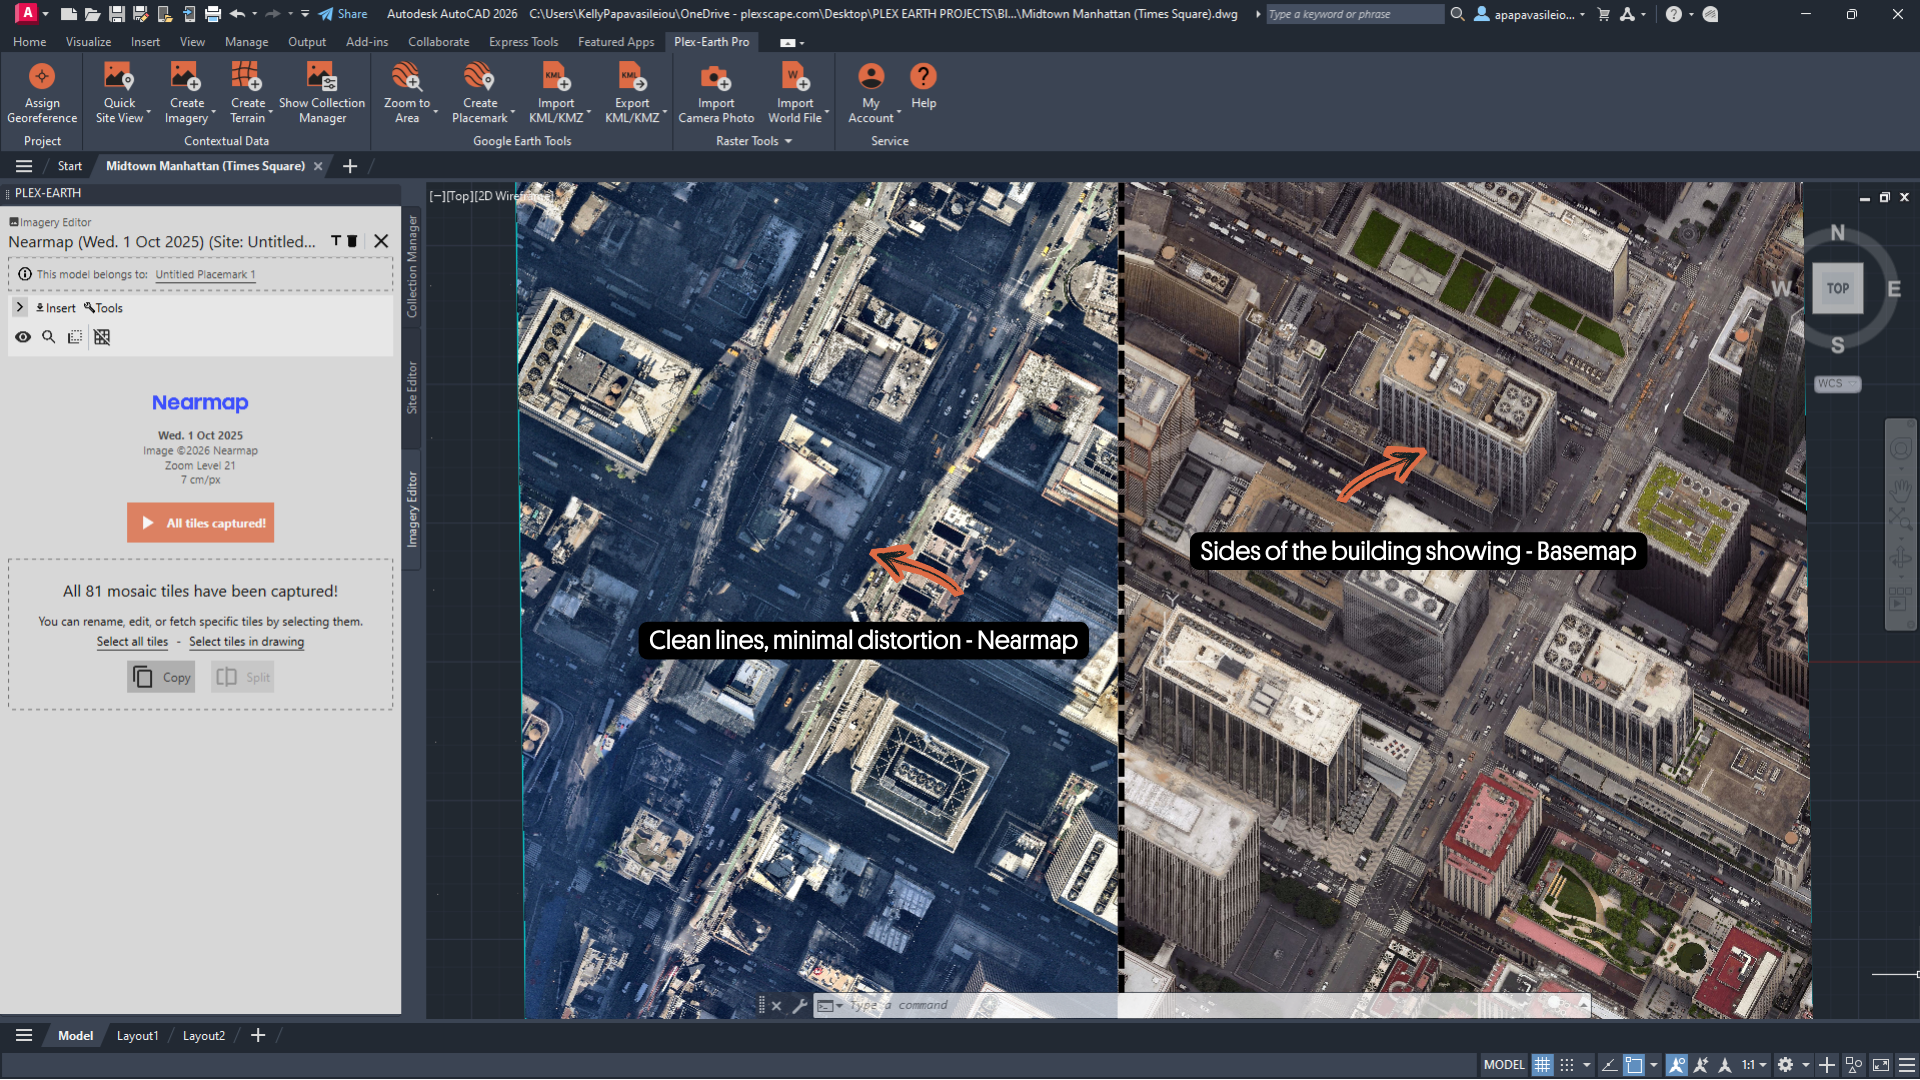
Basemap Imagery displays buildings from an angled perspective, whereas the Nearmap orthomosaic provides a corrected vertical view.
Provider: Nearmap Ltd.
Common use case: High-resolution analysis in dense urban areas
Recency: Updated frequently in covered cities, often multiple times per year
Advantage: Ultra-high-resolution aerial imagery (often sub-3")
Nearmap provides very high-resolution aerial imagery, particularly in dense urban areas where buildings and small infrastructure elements must be clearly visible. They offer orthomosaic imagery with a true top-down view, removing distortions caused by perspective and terrain, allowing engineers to measure distances and place design elements more accurately inside CAD or GIS environments.
Use cases
Solar rooftop design
Engineers designing rooftop solar installations need to clearly see roof edges, HVAC units, skylights, shading obstacles, and roof orientation. And high-resolution imagery helps determine panel placement and usable roof area before site visits.
Construction monitoring
Developers monitor staging areas, material storage, and equipment placement across construction sites using high-resolution aerial imagery. This improved visibility helps project managers coordinate subcontractors, manage logistics, and ensure that construction activities stay on schedule and within budget.
Urban planning
Planners evaluate building footprints, road access, and land use changes using high-resolution orthomosaic imagery. The detailed aerial data provides a clear and accurate view of the urban environment, helping planners analyze site conditions and support better planning and design decisions.
Insurance assessment
Using high-resolution orthomosaic imagery, insurers can remotely assess damage to buildings and surrounding infrastructure. The detailed imagery allows adjusters to evaluate property conditions, identify structural issues, verify property characteristics, and inspect elements such as roads, bridges, parking areas, and access routes. This helps insurance companies and infrastructure owners quickly detect damage caused by events like floods, storms, or earthquakes and support faster, more accurate claims assessments.
Hexagon
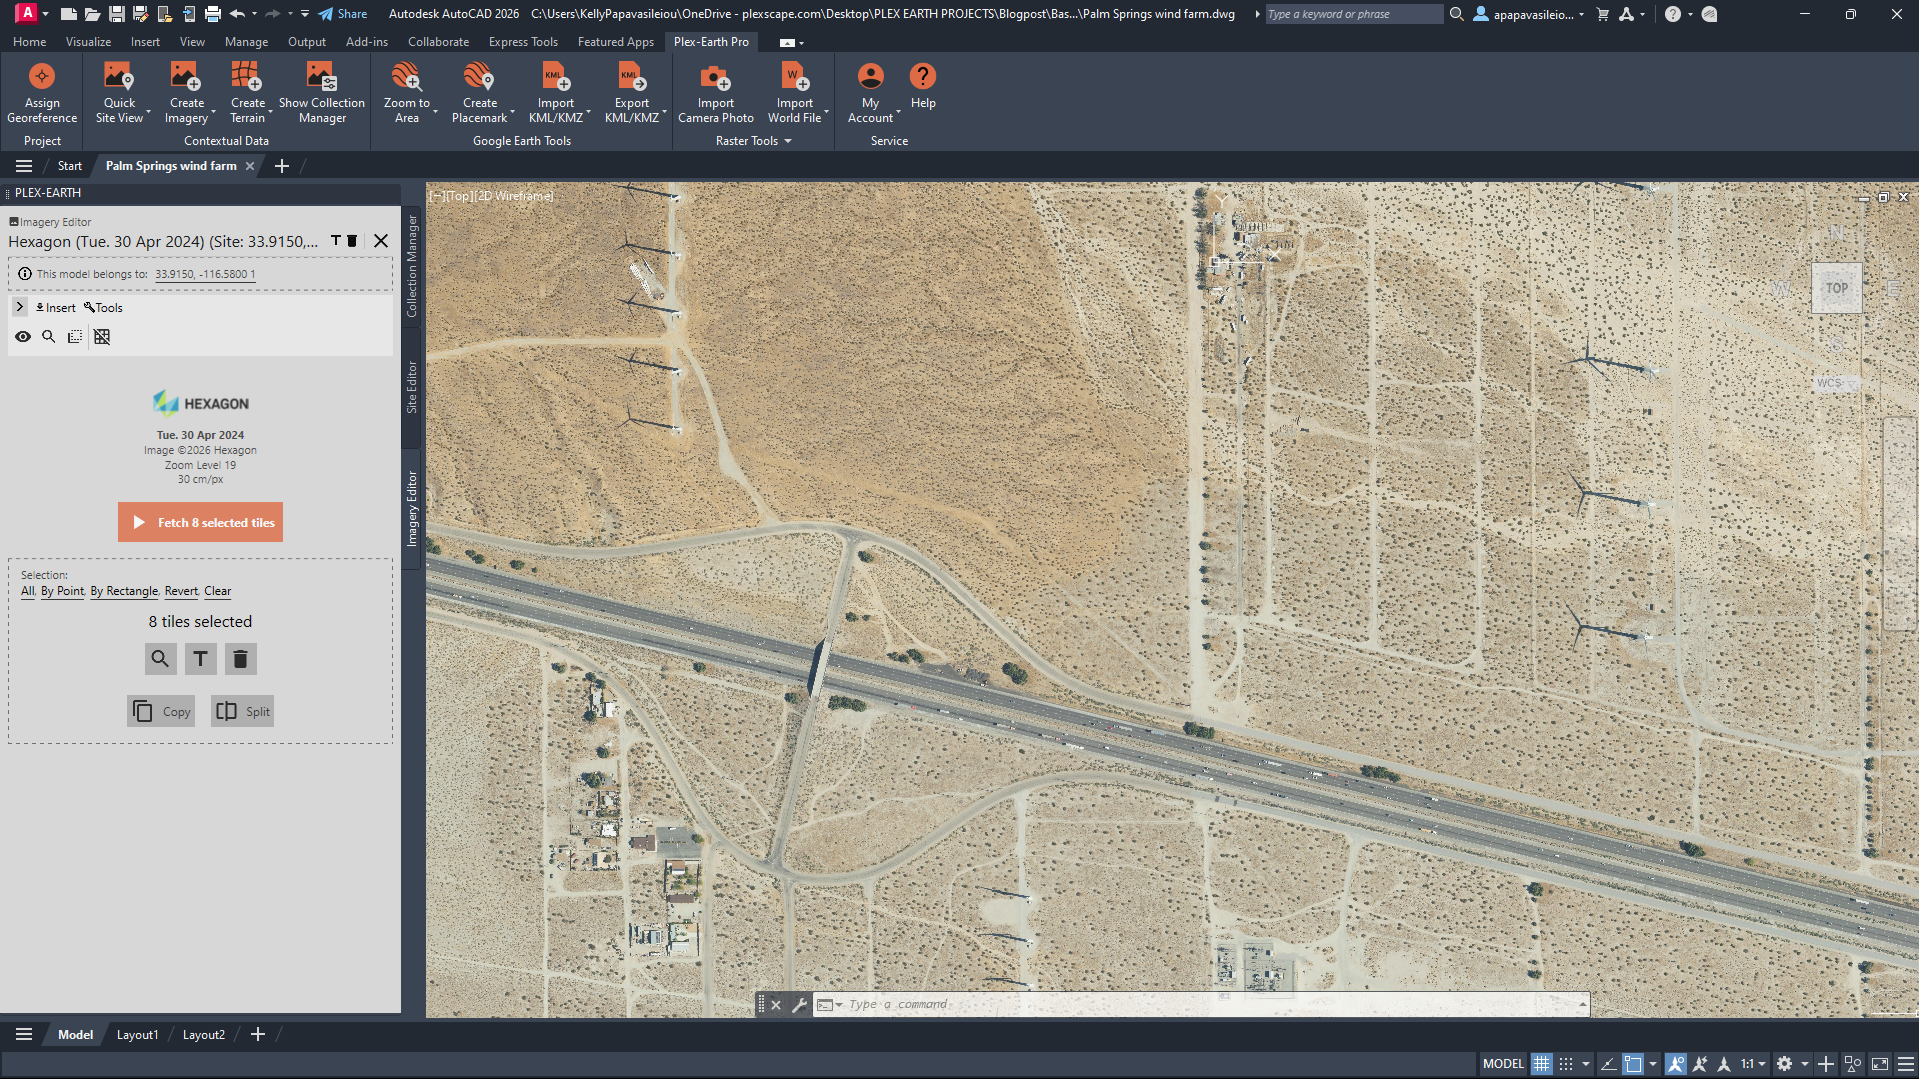
Wind turbines line the Interstate 10 corridor near Palm Springs. The high-quality imagery mosaic of Hexagon clearly shows turbine layouts, access roads, and large-scale energy infrastructure.
Provider: Hexagon AB (Hexagon Geosystems)
Common use case: Large infrastructure projects (highways, pipelines, utilities)
Recency: Updated regularly; varies by region and acquisition cycle
Advantage: Broad aerial coverage with consistent imagery across large territories
Hexagon imagery provides consistent aerial coverage across large areas, including rural and suburban regions. It also offers orthomosaic imagery that supports accurate measurements across large project sites
Use cases
Infrastructure corridors
Hexagon imagery supports the planning of highways, pipelines, railways, and transmission lines across long distances. Its consistent country-wide aerial coverage and high-quality orthomosaic imagery allow planners and engineers to analyze terrain, evaluate route options, and perform accurate measurements across large project areas.
Civil engineering and land development
Engineers and planners analyze terrain, drainage patterns, infrastructure, and access routes across large parcels using high-quality orthomosaic imagery. The consistent aerial coverage supports site evaluation, feasibility studies, and early-stage design for land development projects.
Utility network planning
Planners design power lines, fiber networks, and pipelines across wide territories using consistent aerial coverage and orthomosaic imagery. The detailed imagery helps evaluate terrain, land use constraints, and access routes, supporting accurate planning and design of utility corridors.nvironmental analysis
Supports vegetation studies and land-use assessments across large areas. The consistent coverage allows analysts to evaluate landscape patterns, identify environmental features, and support environmental planning and impact assessments.
Vantor (formerly Maxar) & Airbus

Vantor satellite imagery provides a more up-to-date coverage of the Pilbara mining region than Google Maps & Azure Maps. With multiple acquisition dates available, users can make observations of excavation progress, new infrastructure, and evolving land use across large mining operations.
Provider: Vantor (formerly Maxar) & Airbus Defence and Space
Common use case: Large-scale monitoring and change detection (environment, infrastructure)
Recency: Multiple acquisitions across different dates; supports historical analysis
Advantage: Global satellite coverage with extensive historical imagery archives
Airbus and Vantor provide global satellite imagery with multiple acquisition dates. Their imagery is useful for large-scale monitoring and historical analysis, sometimes with captures only days or weeks old.
Use cases
Environmental monitoring
Airbus and Vantor satellite imagery support environmental monitoring by enabling analysts to track deforestation, erosion, and land cover changes across large regions. Users can compare imagery over time to detect environmental changes, assess impacts, and support conservation and land management efforts.
Infrastructure and regional planning
Airbus and Vantor satellite imagery helps planners understand the broader geographic context for large transportation, energy, or mining projects. The wide-area coverage and multiple acquisition dates allow analysts to evaluate terrain, surrounding land use, and regional constraints during early planning and feasibility studies.
Urban change analysis
Airbus and Vantor satellite imagery enable analysts to study urban expansion and land development patterns across large regions. With multiple acquisition dates, users can compare imagery over time to identify new construction, infrastructure growth, and changes in land use.
Disaster response and construction monitoring
Airbus and Vantor satellite imagery support rapid damage assessment after natural disasters and help monitor construction activity across large or remote sites. Analysts can compare imagery over time to identify affected areas and evaluate site conditions.
Airbus & Vantor support the creation of historical imagery timelines through Plex-Earth, allowing engineers to monitor changes over time, a valuable capability for projects, especially involving land development or environmental analysis.
Choosing the Right Basemap for Your Project
Every project has different data needs, and no single basemap provider works best everywhere. In practice, most engineers figure this out the hard way, after importing imagery that looks fine at a city level but falls apart when you zoom into the actual site.
A simple approach is to match the basemap to the project context:
Google Maps: reliable global imagery and general site context
Azure Maps: consistent worldwide coverage
OpenStreetMap: infrastructure and feature data
Custom map services: regional or specialized datasets
Premium imagery providers: high-resolution imagery for detailed analysis and historical timelines
Having access to multiple basemaps means you can quickly compare providers and pick the one that actually works for your site (resolution, clarity, and recency), not just the one you opened by default. Because each imagery provider updates their datasets independently, certain locations may appear more recent in one basemap than another.
With Plex-Earth, engineers can access a wide variety of basemap providers directly inside their CAD environment, import imagery into their drawings, and connect additional datasets when needed.
If you'd like to explore these capabilities yourself, start a free trial of Plex-Earth and see how the right basemap can improve your workflow from the very beginning.