Imagery Metadata Explained: Key Details & Where to Find Them
Capture date, accuracy, resolution, and more.
Premium imagery in Plex-Earth from Vexcel, Airbus, and Vantor comes with more than pixels. Each one carries metadata, a record of when, how, and with what accuracy it was captured. Reading it is the difference between picking imagery on gut feel and picking it for reasons you can defend.
Metadata is the data about each image: capture date, sensor type, sun position, cloud cover, geographic accuracy, resolution, and more. This information is generated automatically: by the sensor at the moment of capture, by the platform during transmission, and by the processing pipeline before the image is delivered. By the time a premium image loads in your CAD, every detail of how it was made is already attached to it.
Each of these fields exists for a reason. The capture date confirms that the image describes the right project phase. Accuracy values back up any measurement taken on it. Sun and viewing angles confirm the geometry behind a height calculation.
Key metadata & why it matters in AEC work
The most important metadata fields for your day-to-day work are:
Acquisition date
Sun elevation and azimuth
Cloud cover
Resolution and geographic accuracy
Viewing angle
Product type and spectral bands
The actual data each provider collects and shows in their metadata table will be slightly different. There are some commonalities, and knowing them will help you choose the right image for your needs. Together, they give you the context behind every image you load.
Acquisition date
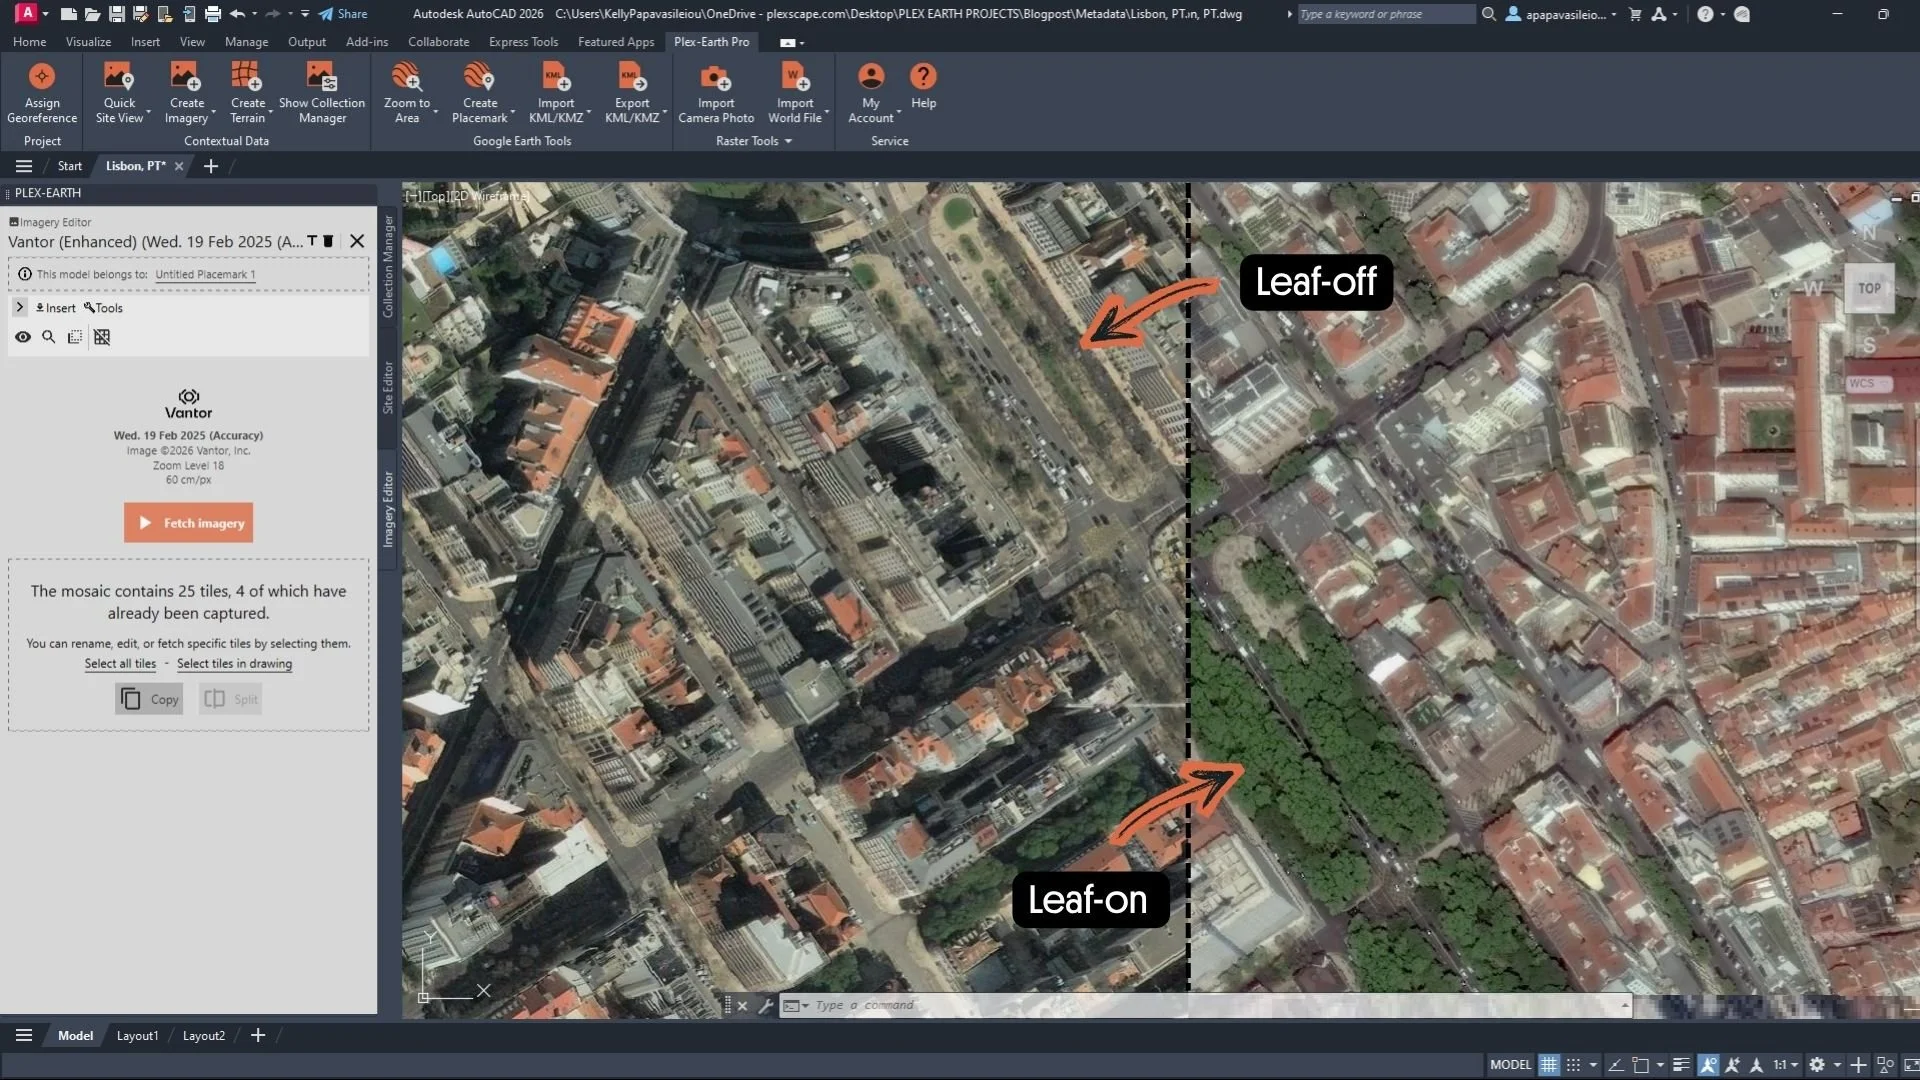
Leaf-off (February) and Leaf-on (April) imagery from Vantor.
The acquisition date tells you when the imagery was taken. It's also the field that determines whether the image describes the project state you actually need.
A scene captured in late January in the Northern Hemisphere likely shows leaf-off conditions, bare trees, exposed terrain, and cleaner sightlines for civil engineering. A summer capture of the same site hides the same terrain under the canopy. For corridor planning — powerlines, pipelines, access roads — that canopy can hide the obstructions and ground features you're routing around. For utility and wind projects in northern latitudes, snow cover can flatten contrast and obscure ground features. That matters when your siting depends on what's actually there — a buried access road, a drainage channel, or an existing structure can change the design but won't show up under the snow. For as-built verification on site, it requires imagery captured after the structure was built, as earlier scenes only show empty ground.
Pulling capture dates upfront means you can verify the recency and possible seasonal effect, and take them into consideration when working on your design.
Sun elevation and azimuth
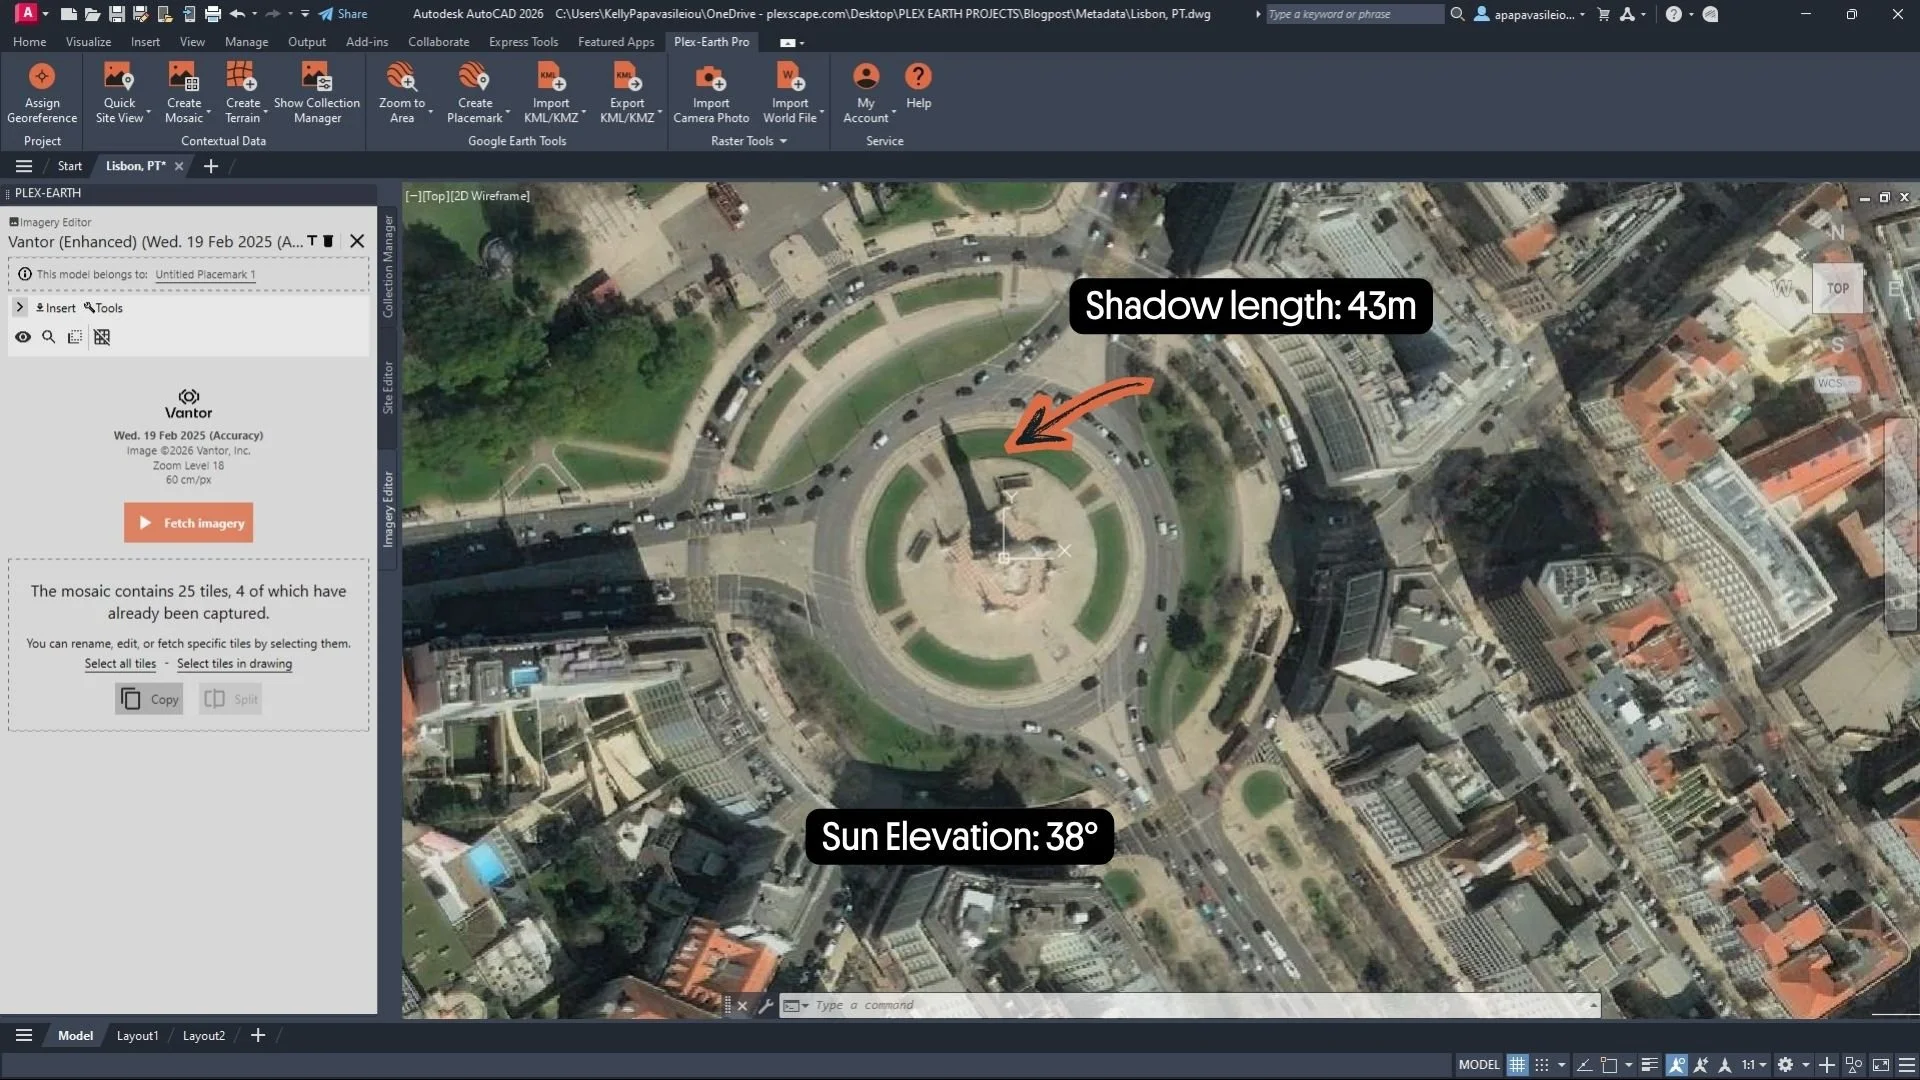
Vantor scene of Lisbon, captured at noon on 19 February. Sun elevation: 38°. Shadow of the Marquês de Pombal statue: 43m.
Sun elevation tells you how high the sun was in the sky at capture. Azimuth tells you which direction it was coming from. Together, they define the geometry of every shadow in the image.
If you know the sun elevation, you can measure a shadow and estimate the height of the object casting it. It's basic trigonometry: height = tan(sun elevation) × shadow length.
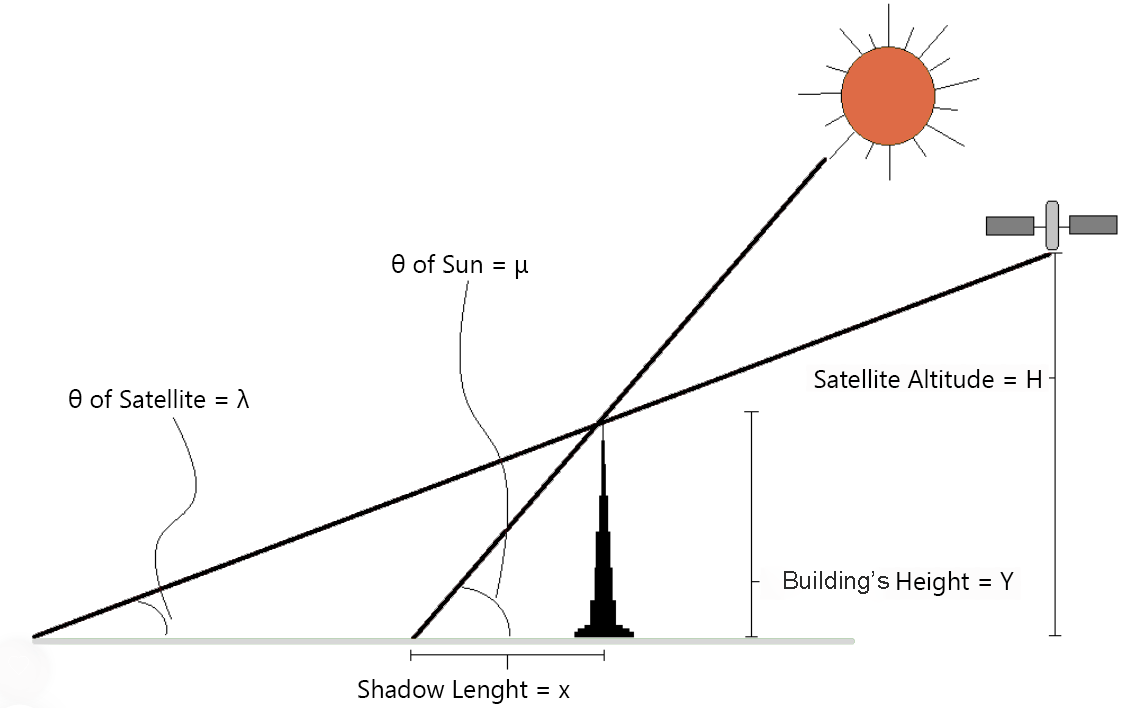
Diagram showing the geometry of measuring a building's height from a satellite image.
For example, the Marquês de Pombal statue in Lisbon cast a 43m shadow at a sun elevation of 38° in 19th of February. Plug those in: tan(38°) × 43m ≈ 34m (about 1692 inches) — which matches the statue's actual height. While this may not replace a survey or LiDAR data, it can provide useful preliminary insight during early-stage analysis.
For solar projects, the shadows reveal where buildings, vegetation, and terrain block sunlight at the moment of capture. That's useful for early shade analysis. But it's only one point in the daily cycle. Reading the azimuth and elevation tells you which point: peak sun, mid-afternoon, or low light.
For vertical assets, towers, stacks, and transmission lines, shadows reveal—and conceal—at the same time. From directly above, a lattice tower is a small cluster of pixels, but its shadow on flat ground spreads the structure into a long, readable outline. The same shadow can also hide what's at the base of the structure, foundation pads, access tracks, and ground-mounted equipment. Anything in shadow disappears in the image. Sun elevation and shadows give you a hint if the area needs to be checked for any hidden ground features before you commit to the design.
Cloud cover
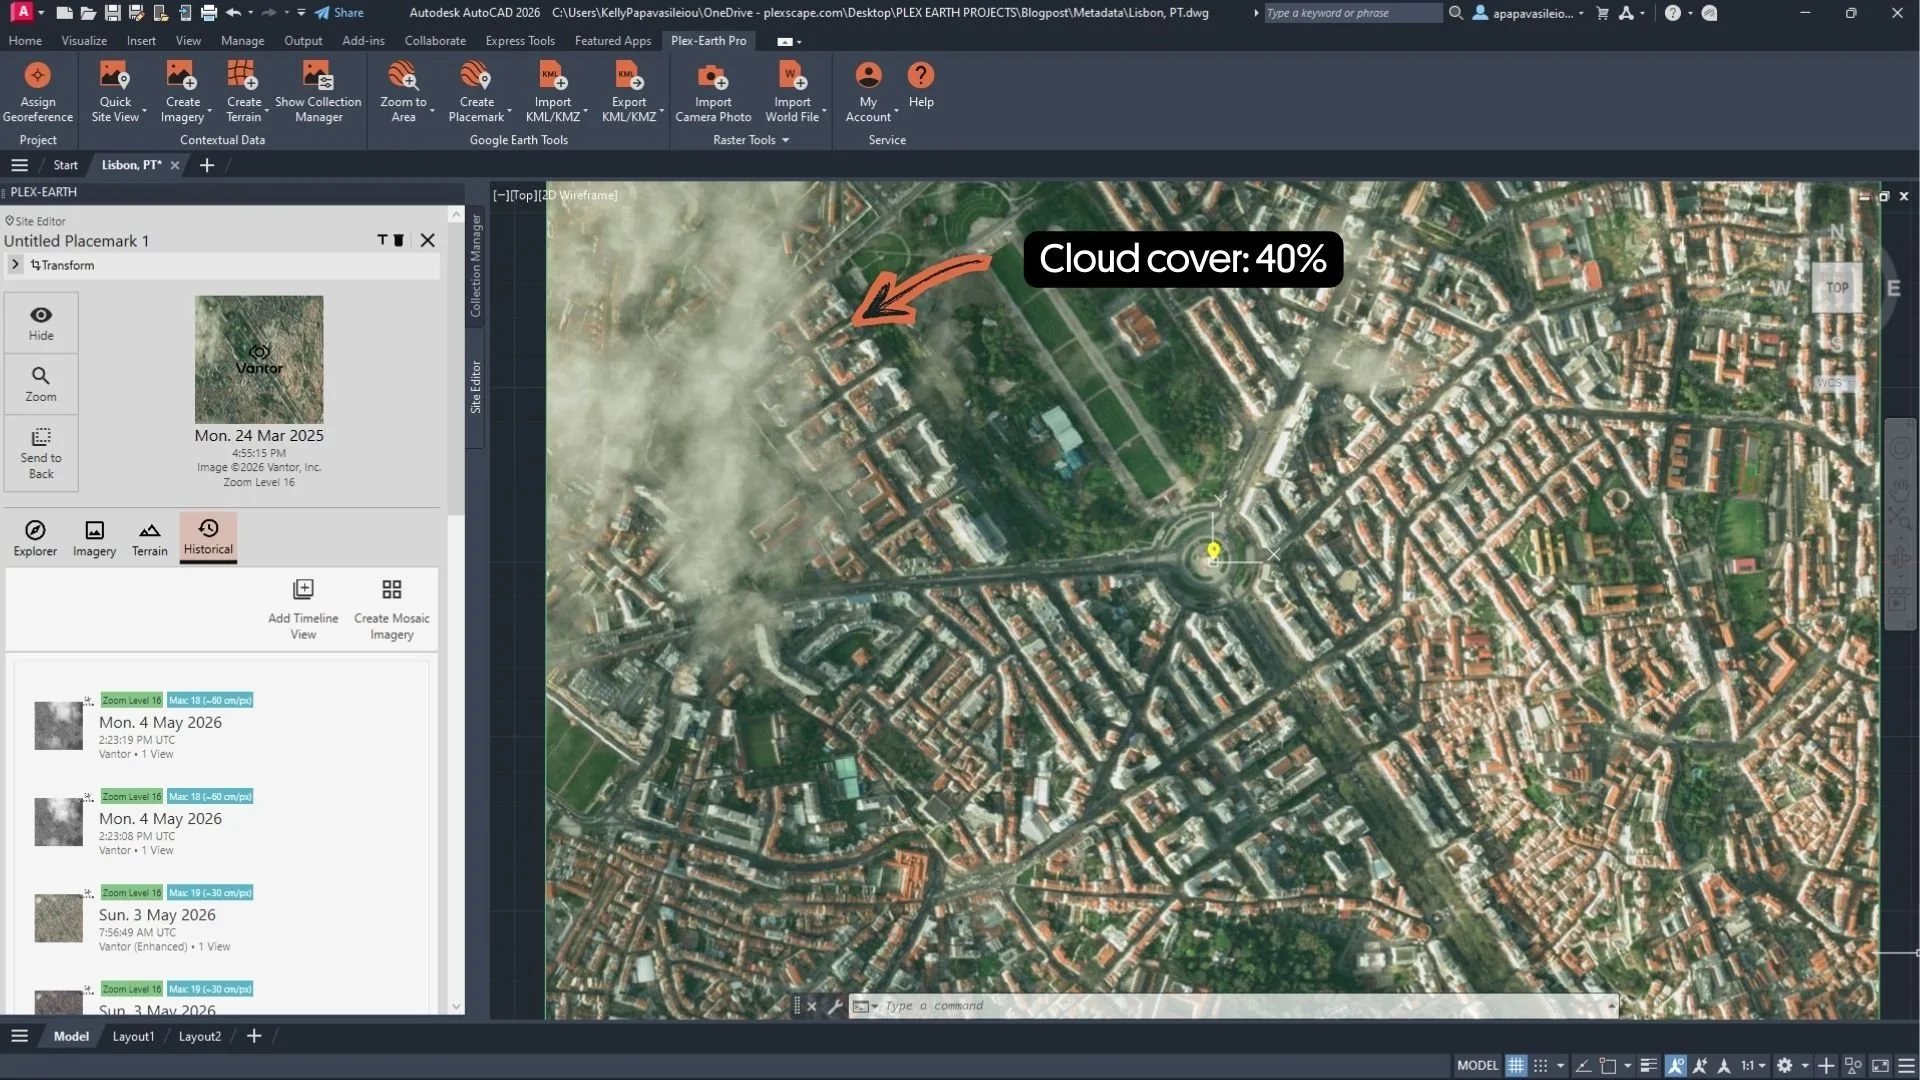
Vantor imager with Cloud cover: 40%. The cloud cover is high, but the area of interest — the avenue and the park at centre — sits in a clear gap, making the imagery fully usable.
Cloud cover is reported as a percentage of the scene obscured by clouds. The value lets you filter out unusable imagery before you've spent time loading it. Lower values mean more of the surface is visible, which usually translates to more usable imagery.
However, the percentage is scene-wide average, so spatial distribution matters more than the value alone. A Vantor scene at 0.03% is essentially clear. A scene at 10.28% might still have your site clear, or might not, so spot-checking the area of interest still pays off.
For time-sensitive work, emergency response, post-event surveys, construction progress, scanning a Timeline by cloud cover and picking the first clean capture saves real time.
Resolution and geographic accuracy
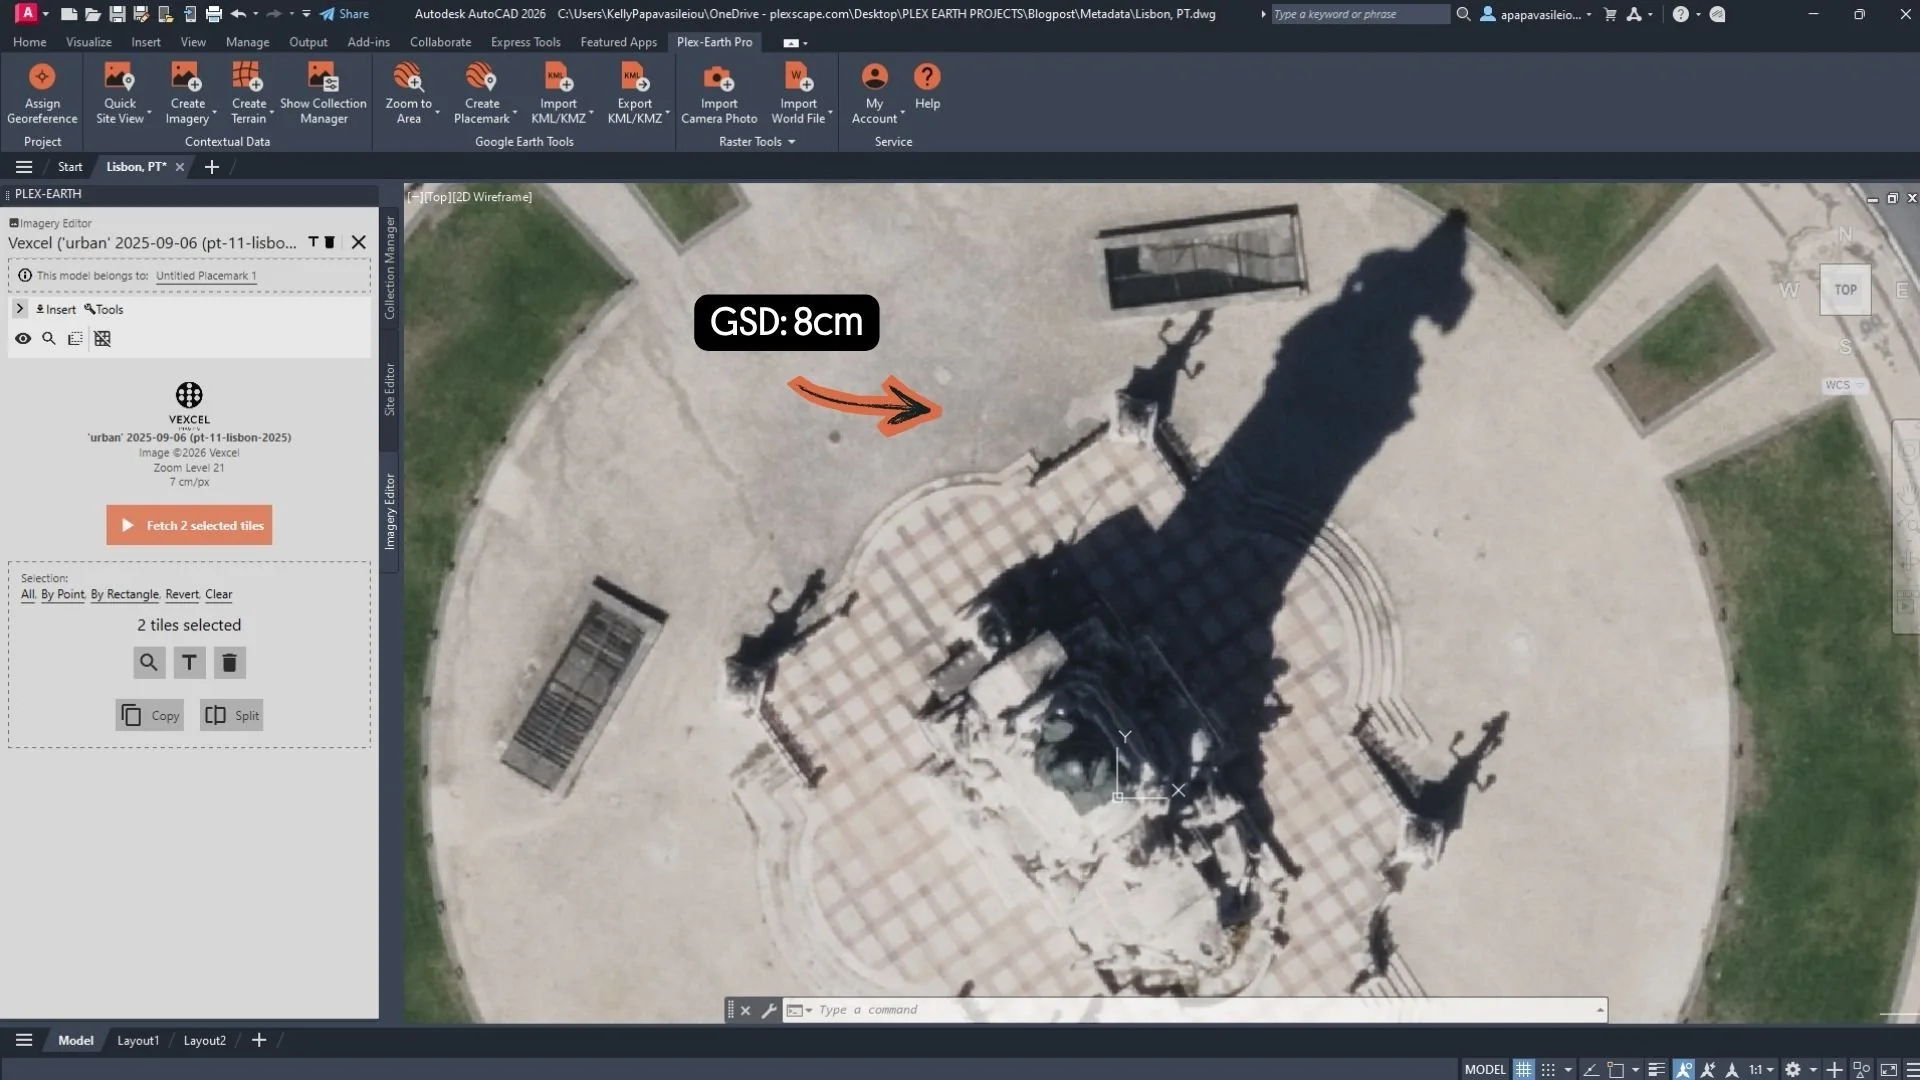
Vexcel aerial imagery at 8cm GSD (about 3 inches per pixel) — fine enough to resolve individual road markings, vehicles, and rooftop details.
Resolution tells you how much detail an image holds. The technical measure is Ground Sample Distance (GSD): the distance on the ground represented by each pixel. A smaller GSD means a more detailed image.
Satellite imagery is captured by satellites in orbit; aerial imagery is captured by aircraft flying over a target area. Airbus Pleiades images report 0.5m (about 20 inches) GSD, while SPOT images report 1.5m . Vexcel aerial imagery typically runs in the centimeter range because aircraft fly far lower than satellites, capturing finer detail per pixel.
Aerial datasets also report minimum, maximum, and average GSD rather than a single value. The reason: a satellite scene is one capture from a single overpass, but an aerial dataset is built from multiple flight passes — sometimes over days or weeks — so the GSD varies slightly across the coverage. The three values tell you the range you're working with.
Required detail varies by project. A regional corridor study can work on 1.5m imagery. An urban design, drainage review, or detailed site assessment usually needs sub-meter or centimeter-scale data to be useful.
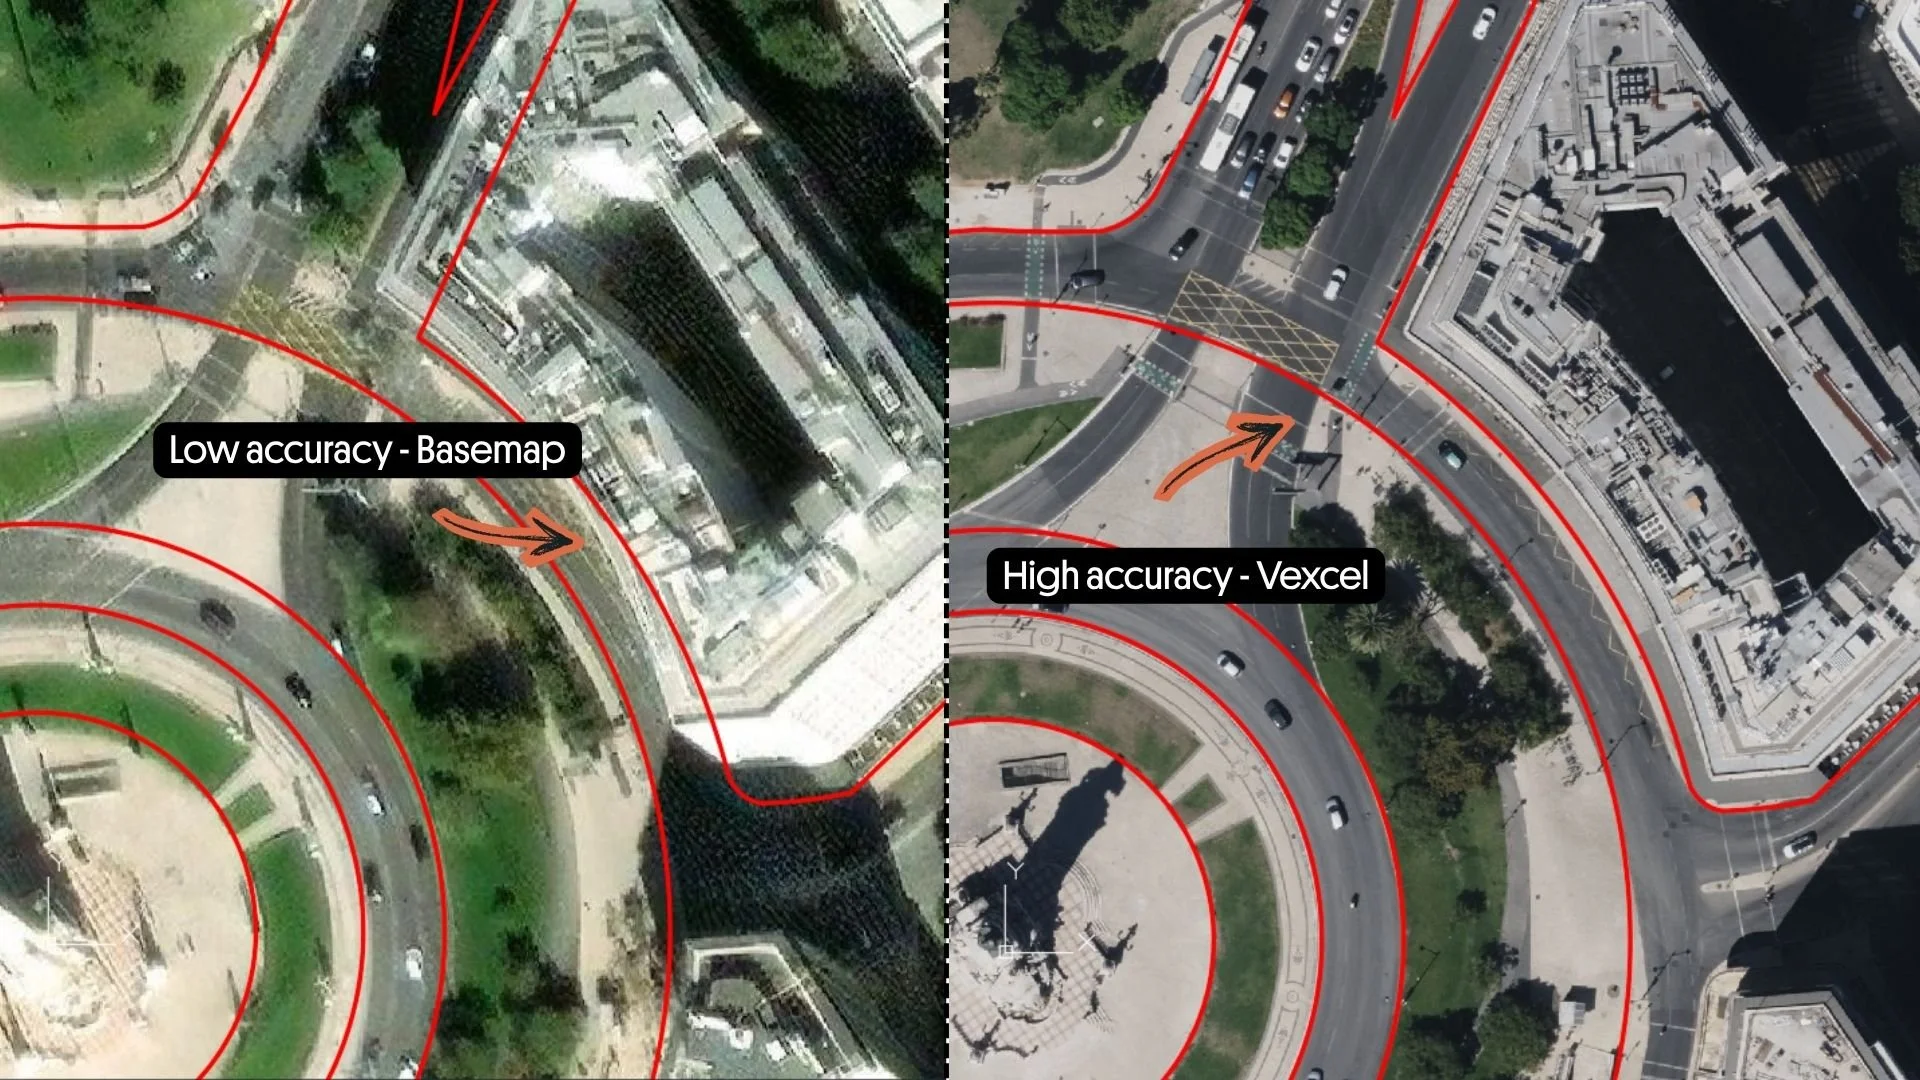
Low-accuracy basemap (left): the red lines miss the road and building edges. High-accuracy Vexcel imagery (right): the same lines sit where they should.
Vantor scenes also expose two accuracy values: CE90 (Circular Error 90%) and RMSE (Root Mean Squared Error). Both measure how accurately the image's coordinates match the real ground location, expressed in meters. A lower CE90 or RMSE value means better accuracy.
A CE90 of 8.4m (about 300 inches) means 90% of points in the image sit within 8.4m of their true location on the earth. That uncertainty propagates into anything you measure on the scene. If the imagery is positionally accurate to within 8.4m, your measurements on it cannot defensibly claim tighter precision than that.
Viewing angle
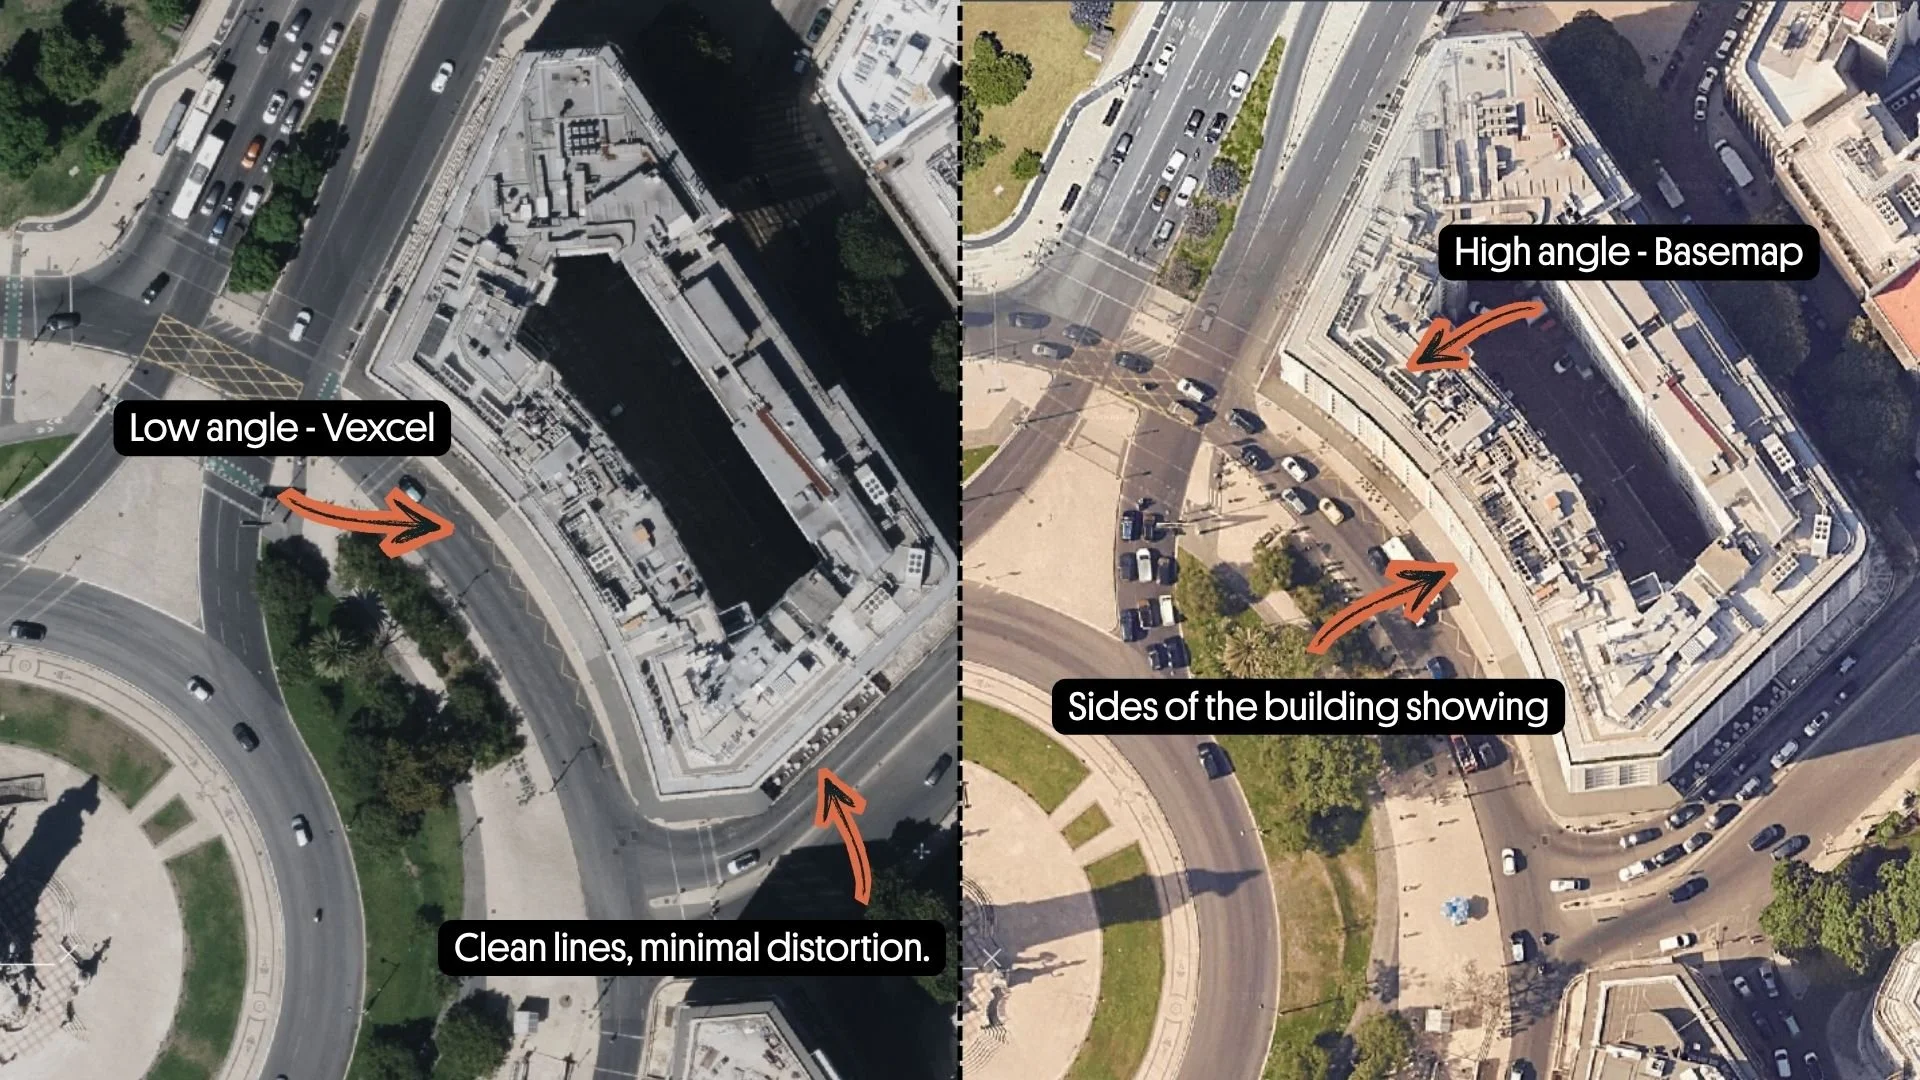
Near-nadir Vexcel imagery (left): clean rectangular rooftop, accurate footprint. High off-nadir basemap (right): the building's sides are visible and the footprint is stretched.
A value near zero means the sensor was looking straight down at the target; higher values mean a more oblique look. Both Airbus and Vantor report this in their metadata — Airbus calls it Incidence Angle, with across-track and along-track components; Vantor calls it Off-Nadir Angle.
Lower angles produce less distorted imagery. A near-nadir scene gives the truest top-down view of a footprint, which matters when measuring areas, building outlines, or any feature where horizontal accuracy is the deliverable. Higher angles introduce visible lean in tall structures and stretch shadows differently across the scene.
For measurement work, sorting candidate scenes by viewing angle is often as useful as sorting by capture date.
Product type and spectral bands
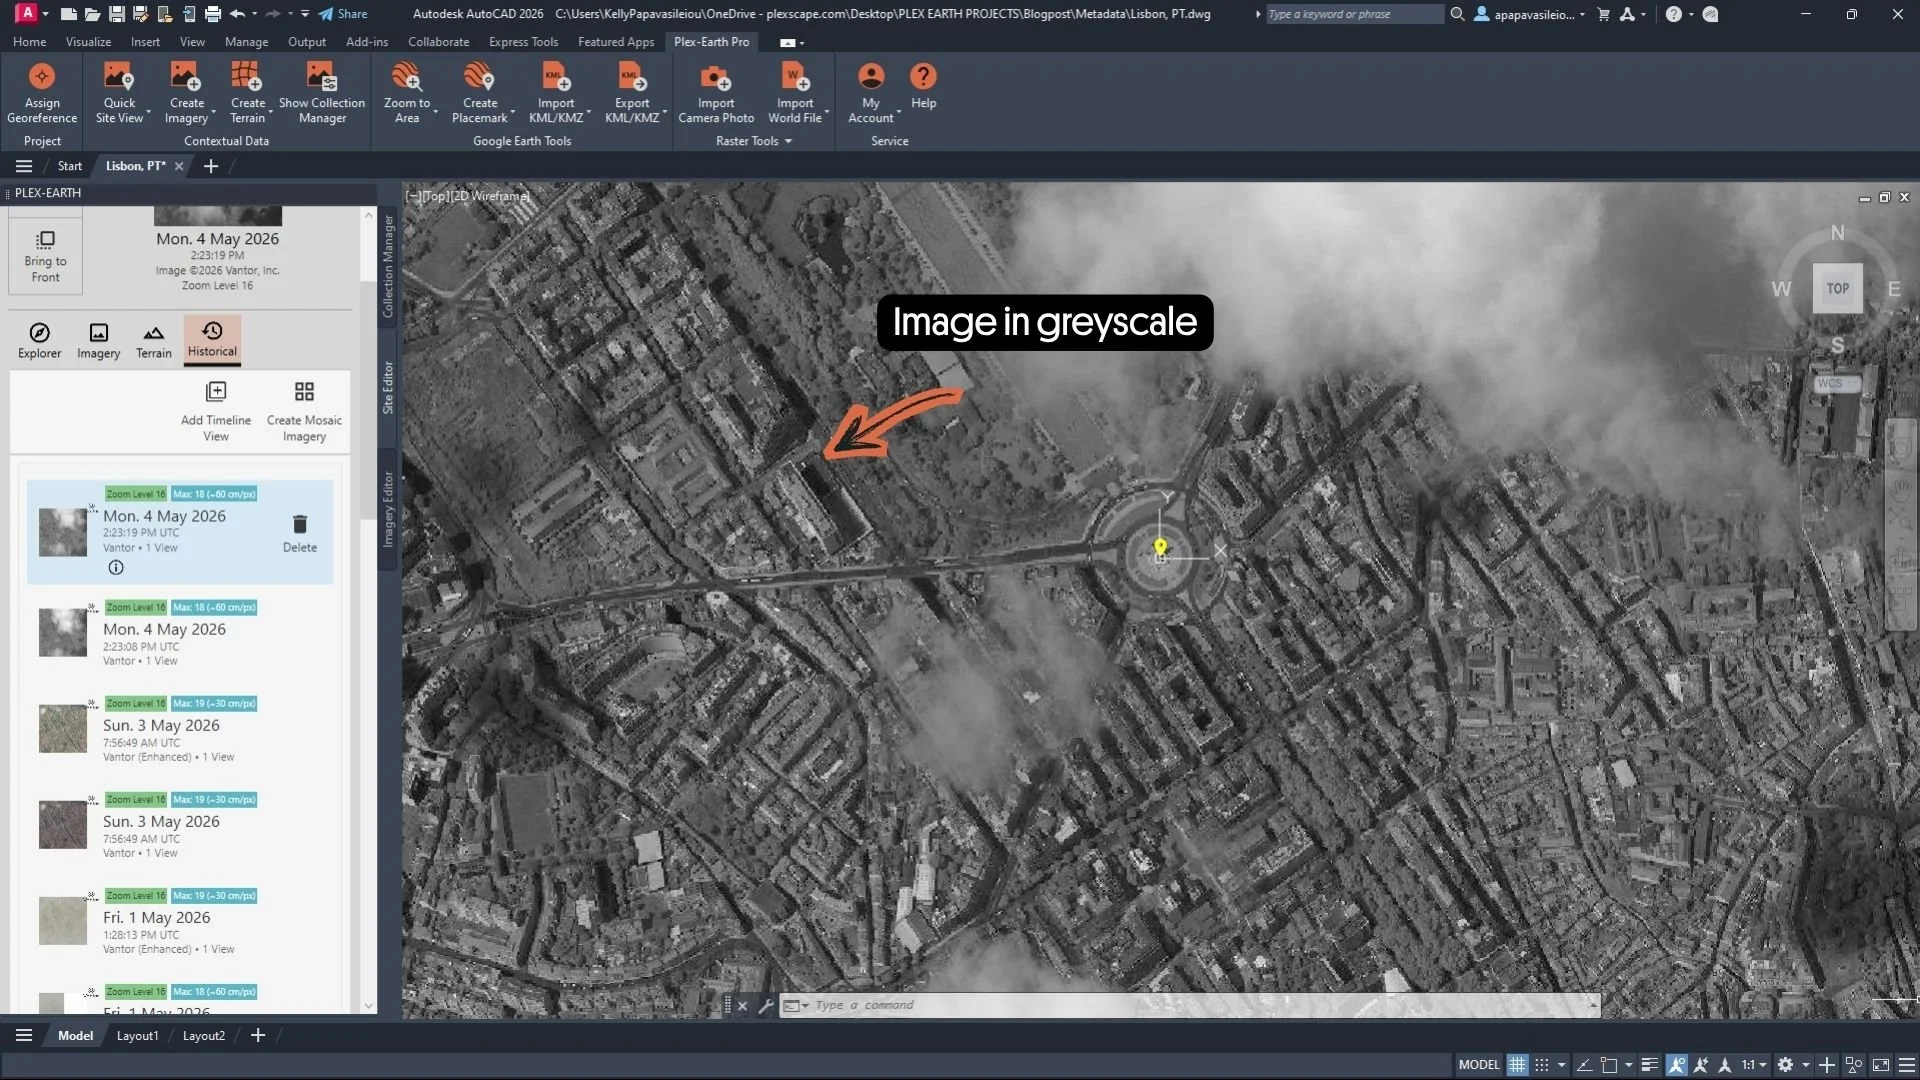
Vantor panchromatic scene. Single band, greyscale, maximum resolution.
The Product Type and Bands fields describe the spectral content of the image, which parts of the light spectrum were recorded, and how those bands are packaged. Airbus and Vantor list Product Type values like Panchromatic, Multispectral, Bundle, or Pan Sharpened Natural Color. Vexcel exposes a Bands field that names the available bands — for example, rgb (visible color) or irg (infrared, red, green).
These fields determine what the imagery can be used for. Panchromatic gives you the highest resolution, but in greyscale only. Multispectral or pan-sharpened gives you color at slightly coarser detail. Near-infrared bands make it possible to run vegetation indices like NDVI (Normalized Difference Vegetation Index), water detection, or land-cover classification.
For routine design work, RGB or pan-sharpened color is usually what's needed. For environmental, agricultural, or land-management work, confirming the near-infrared bands are present before committing to a dataset saves a return trip later.
Best use cases according the providers
The three providers report different metadata because they collect imagery differently. Knowing what each one is strong at helps you pick for the task.
Use Airbus when you need full transparency on sensor geometry, incidence angles, illumination angles, processing level, alongside consistent, known resolutions.
Vantor is the right choice when geolocation accuracy is the thing you have to defend. It's the only provider that exposes CE90 and RMSE values, and it reports Off-Nadir Angle for measurement-critical work.
Vexcel is best when you need very high-resolution and current urban-area coverage. Its Occlusion Estimate and Score flag how much of your area of interest is hidden behind buildings or other obstacles before you commit to the dataset.
Where to find Metada in Plex-Earth?
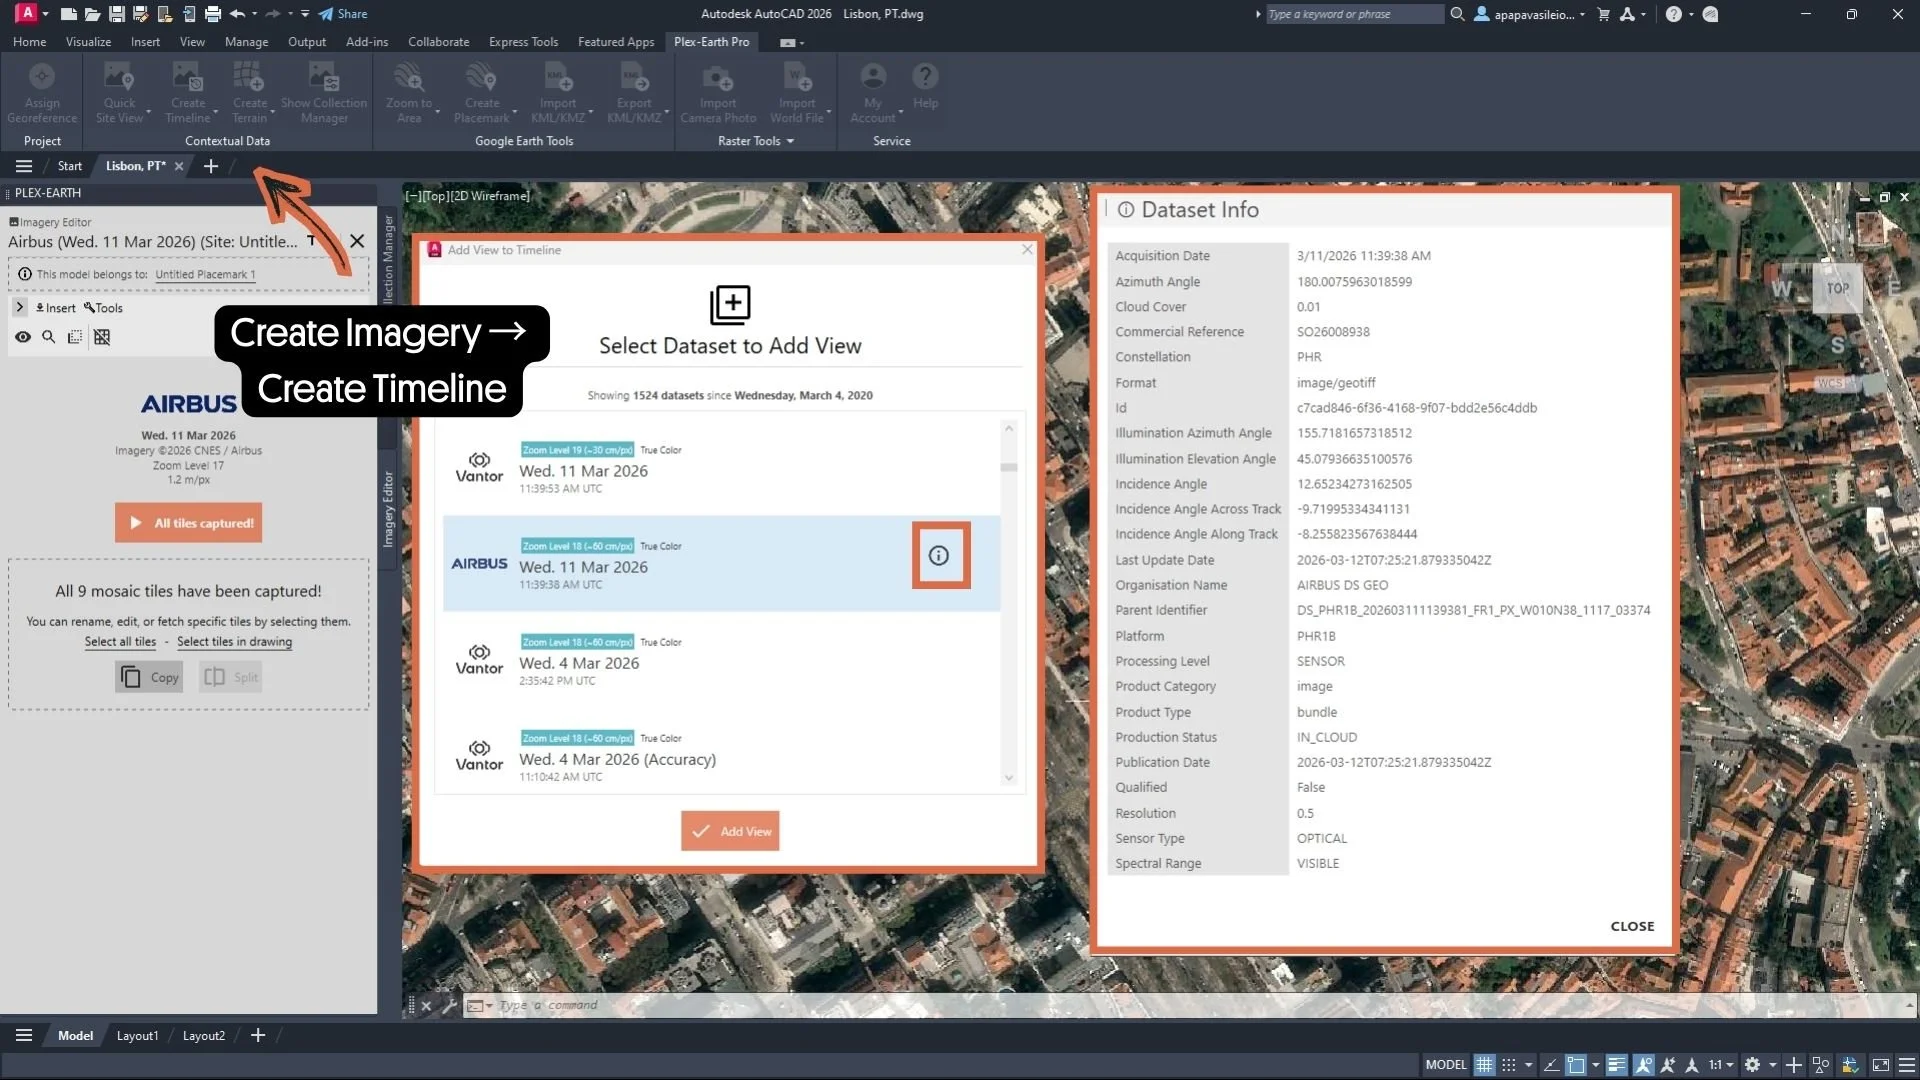
Accessing Airbus metadata. Create Imagery → Create Timeline → hover the dataset → click the dataset info icon.
Inside Plex-Earth, metadata is one click away. For Airbus and Vantor imagery in Timeviews, hover over a dataset and click the dataset info icon next to it — the full metadata panel opens.
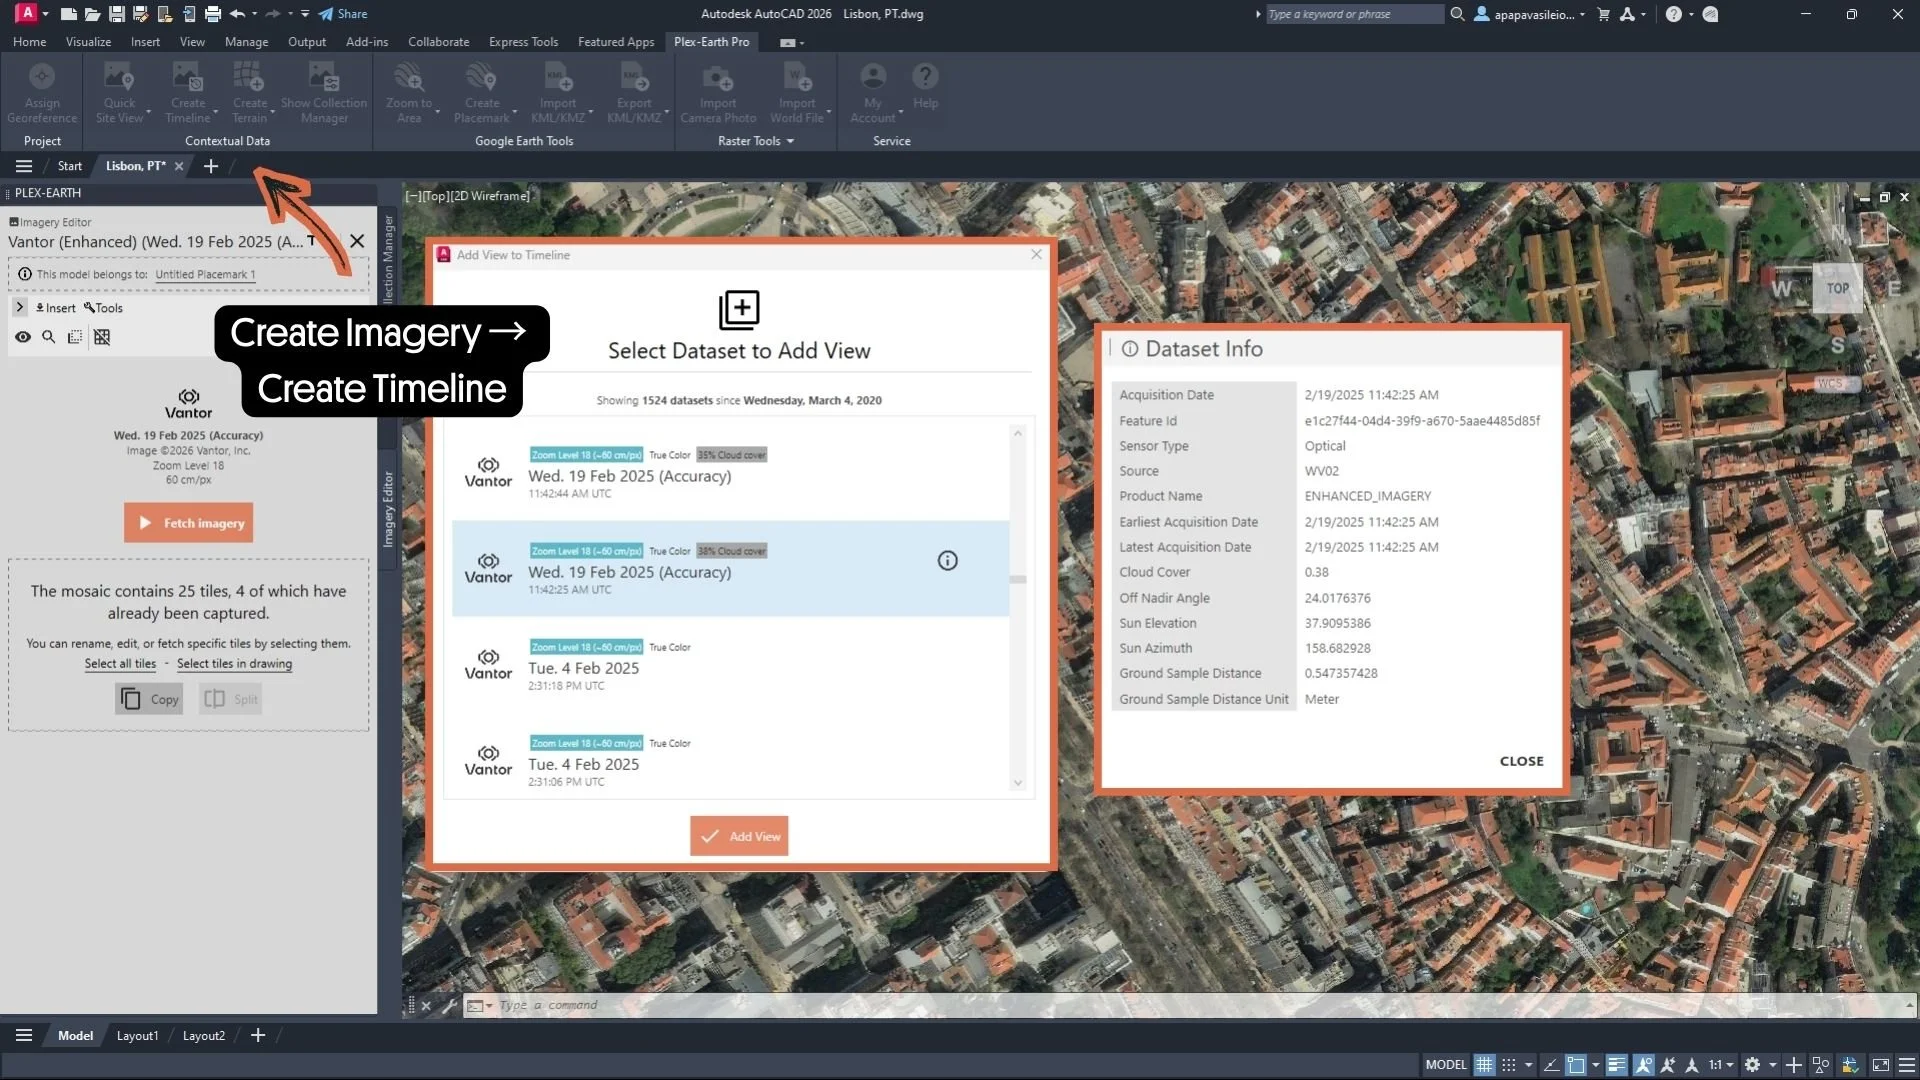
Accessing Vantor metadata. Create Imagery → Create Timeline → hover the dataset → click the dataset info icon.
For Vexcel imagery, click the three-line icon inside the Select Source Wizard. All of this happens inside your CAD environment — no separate window, no extra step.
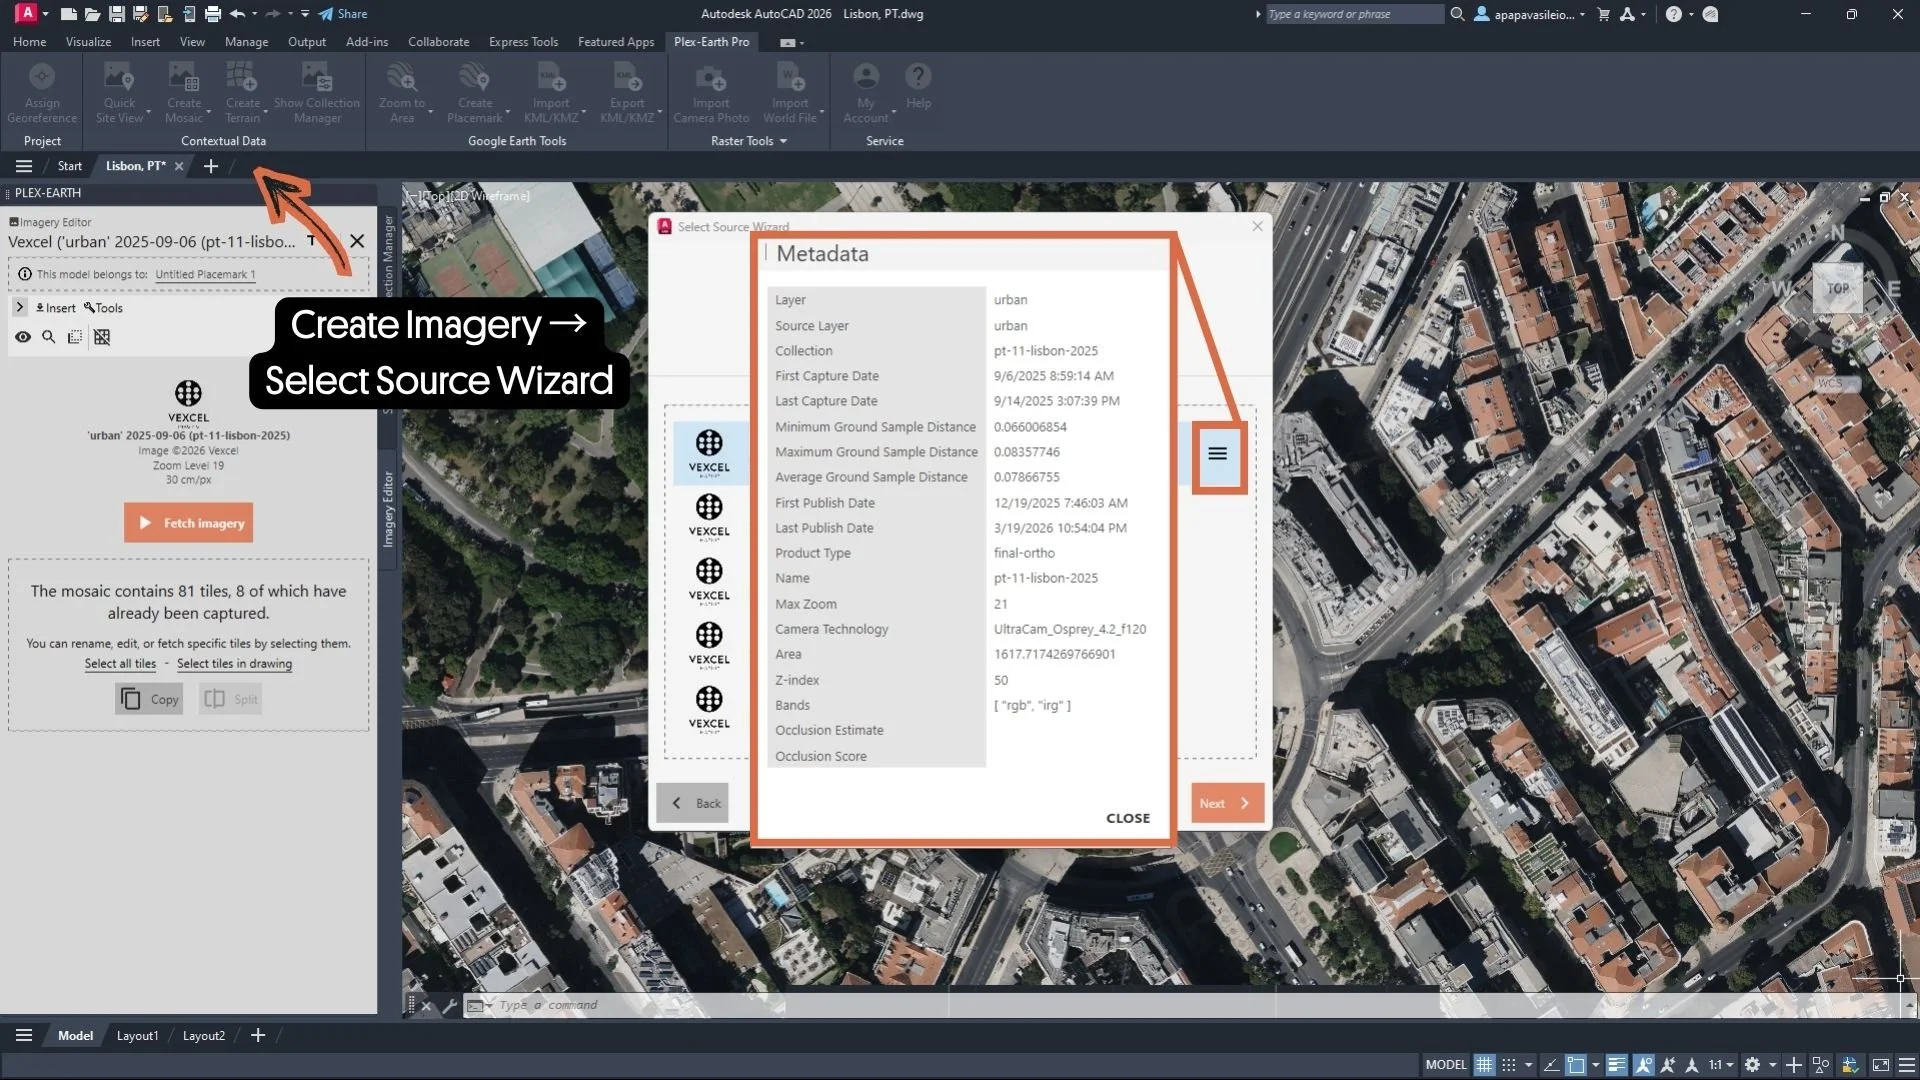
Accessing Vexcel metadata. Select Source Wizard (Mosaic Creation) → click the three-line icon next to the dataset.
In Plex-Earth, accessing this information directly inside the workflow allows users to evaluate imagery before inserting or relying on it. That means fewer assumptions, better visual interpretation, and more confidence in the data used to support design and planning decisions.
Because in professional work, the image itself is only part of the story. Metadata helps reveal the rest.
For a closer look at the metadata fields, see the Airbus or Vantor (Maxar) Metadata article. To set up a Timeline with historical imagery, see the Create Timeline guide. To access Vexcel’s imagery, check the Create a mosaic guide.
Want to put metadata to work in your own projects? Start your free Plex-Earth trial and explore premium imagery from Airbus, Vantor, and Vexcel directly inside your CAD environment.